Your Time has Finished
Loading...

BMAT 2004-S1
Your Score: %
Average Score of All Users:
You performed better than of students
Section Breakdown
| Your Score | Average of all Users | Percentile | |
|---|---|---|---|
| BMAT 2004 S1 |
BMAT 2004 S1
Your score:
Average score:
You performed better than of students
This section is Section 1 of 3.
Speed as well as accuracy is important in this section. Work quickly, or you might not finish the paper. There are no penalties for incorrect responses, only marks for correct answers, so you should attempt all 35 questions. Each question is worth one mark.
You must complete the answers within the time limit. Calculators are NOT permitted.
Good Luck!
Note – if press “End Exam” you can access full worked solutions for all past paper questions
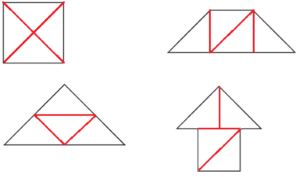
A seminar room has four identical tables, the shape of each being an isosceles right-angled triangle.
Explanation
The correct answer is C.
A can be divided into 4 isosceles right-angled triangles by drawing a diagonal line from the top left to bottom right corner and another line from the top right to bottom left corner. B can be divided by drawing a line bisecting the triangle through the right angle, and then two more lines from the midpoint of each edge to the point where the base was bisected by the first line drawn. D can be divided by drawing two vertical lines from each of the two upper corners to the base of the trapezium to create a square in the middle of the trapezium, and then drawing a diagonal line across the square to form two more triangles. E can be divided by drawing a horizontal line from the two points of the sides of the arrow to form a square below the line and a triangle above the line, and then splitting the triangle vertically through the midline and the square diagonally. Therefore C is the only shape that cannot be made using 4 right-angled isosceles triangles
.
Nutritionists say that we should eat more fruit and vegetables per day and reduce our intake of fat to help prevent major illnesses. As fruit and vegetables are relatively expensive compared to fatty foods, it is unlikely that families on very low incomes will follow this advice. If the government really wants to improve the health of the nation, it will have to consider taxing foods which are high in fat.
Explanation
The correct answer is C.
The main conclusion of the passage is that taxing high content food may lead to a decrease in their consumption. This is strengthened by statement C as it explains that similar measures were imposed on smoking cigarettes which lead to reduced levels of smoking.
Of the 100 screws in my work box:
60 are cross-headed and 40 are slot-headed
70 are 3 mm diameter, 20 are 4 mm diameter and 10 are 5 mm diameter
80 are 50 mm long, 5 are 35 mm long and 15 are 20 mm long.
Explanation
The correct answer is B.
70 screws are 3mm in diameter. 40 of these could be slot-headed, leaving only 30 which must be cross-headed. 5 screws are 35mm long and 15 are 20mm long, which could all be both cross-headed and 3mm in diameter, leaving only 30-(5+15)=10 screws which are cross-headed, 3mm diameter and 50mm long.
The government now insists that all primary schools spend at least one hour per day on literacy and numeracy work, and stipulate that a substantial part of the time is spent in whole class teaching. These changes have helped to raise standards in literacy and numeracy. Therefore, whole class teaching is clearly more beneficial than small group or individual work.
Explanation
The correct answer is A.
Statement A is correct here because the passage concludes that whole class teaching is superior to small group teaching. Therefore it assumes that the improvement in raised standards in literacy and numeracy is due to the teaching style rather than making one hour of literacy and numeracy work mandatory. This is summarised in statement A. Statements B-E are incorrect because there is no mention of this in the passage.
Tom and Suki are brother and sister and go to the same school which is 2 km from their home. Suki leaves each morning 10 minutes before Tom and walks. Tom cycles to school by the same route at four times Suki’s walking speed and arrives there 5 minutes before her.
Explanation
The correct answer is C.
Tom has completed the journey to school 10+5=15 minutes faster than Suki (as he leaves 10 minutes later than her but arrives 5 minutes before her) and he travels at 4 times her speed. Therefore we can write:
| Distance (km) | Speed (km/h) | Time (h) | |
| Suki | 2 | v |
t |
|
Tom |
2 | 4v |
t-0.25 |
Where v=Suki’s speed and t=the time it takes Suki to get to school.
Using distance=speedxtime, we can write the following equations:
2=vt and 2=4v(t-0.25)
Rearranging to make t the subject and substituting:
t=2/v
2=4v(2/v-0.25)
2=8-v
v=8-1=6.
So Suki travels at a speed of 6km/h.
When Tom leaves, Suki has be walking for 10 minutes, so using distance=speedxtime she would have travelled:
6x(10/60)=6×1/6=1km.
Recent research has shown that people who keep pets tend to live longer than those who do not. The explanation seems to be that factors such as increased exercise (for dog or horse owners), the soothing properties of stroking a furry animal (such as a cat) and the emotional benefits of affectionate relationships combine to benefit human longevity. Everyone who can own a pet, should do so. Obviously this suggestion is not appropriate to people who are allergic to animals.
Explanation
The correct answer is E.
The conclusion here is that everyone who can own a pet, should do so and the reason given is that people live longer. However, we are assuming that this is a reason – people should try and live longer and owning a pet is a method of doing so. This is summarised in statement E.
Statement A is a suggestion – saying “never have pets” is an example of extreme language which reduces likelihood of it being an assumption.
Statement B is incorrect as there is no mention of more than one pet.
Statement C is incorrect as the ‘emotional benefits of affectionate relationships’ isn’t linked to specific animals.
Statement D is also incorrect as this is not an assumption that leads to long-term impacts and so we are assuming it will be more than a short term problem.
Alf and Bill are gardeners. They work together and share profits equally. They recently built a fence for a client. Alf bought all the materials at a total cost of £240. The client paid Bill £780 on completion of the work.
Explanation
The correct answer is D.
The total profit made was 780-240=£540. So Bill and Alf need 540/2=£270 each. Alf currently is at a loss of £240, so for the profits to be shared equally Bill would need to pay him 240+270=£510.
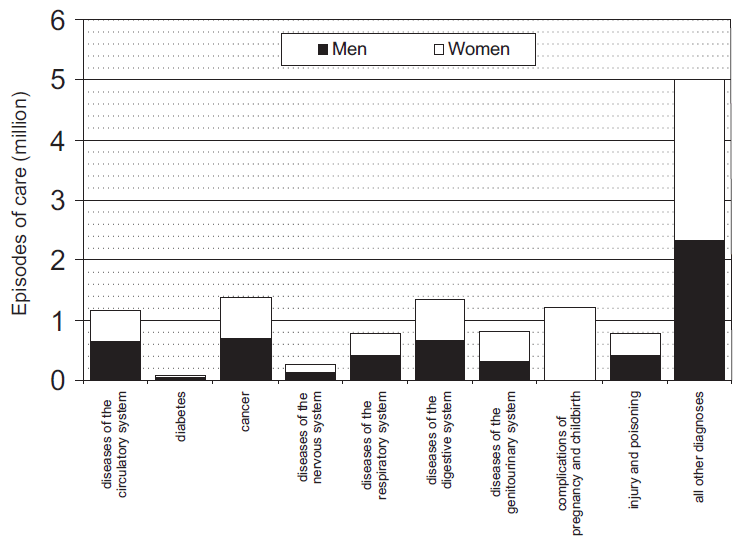
The graph below shows the number of stays in national health service hospitals in England by diagnosis and sex in 2002/3.
The table below shows the actual number of days in hospital for the same data.
|
Main diagnosis |
Days in hospital |
| Diseases of the circulatory system |
7,625,301 |
|
Diabetes |
368,780 |
| Cancer |
4,343,199 |
|
Diseases of the nervous system |
1,742,156 |
| Diseases of the respiratory system |
3,892,460 |
|
Diseases of the digestive system |
3,533,337 |
| Diseases of the genitourinary system |
2,207,105 |
|
Complications of pregnancy and childbirth |
1,988,492 |
| Injury and poisoning |
4,954,304 |
|
All other diagnoses |
21,781,029 |
| All diagnoses |
52,436,163 |
Explanation
The correct answer is A, B & C (12.0, 12.5 or 13.0).
Adding up the number of episodes of care for each bar in the graph:
1.2+0.1+1.4+0.3+0.8+1.4+0.8+1.2+0.8+5=13 million.
The graph below shows the number of stays in national health service hospitals in England by diagnosis and sex in 2002/3.
The table below shows the actual number of days in hospital for the same data.
|
Main diagnosis |
Days in hospital |
| Diseases of the circulatory system |
7,625,301 |
|
Diabetes |
368,780 |
| Cancer |
4,343,199 |
|
Diseases of the nervous system |
1,742,156 |
| Diseases of the respiratory system |
3,892,460 |
|
Diseases of the digestive system |
3,533,337 |
| Diseases of the genitourinary system |
2,207,105 |
|
Complications of pregnancy and childbirth |
1,988,492 |
| Injury and poisoning |
4,954,304 |
|
All other diagnoses |
21,781,029 |
| All diagnoses |
52,436,163 |
Explanation
The correct answer is A.
From the graph, the number of episodes of care for cancer is approximately 1.4 million. The number of days in hospital for cancer is given in the table as 4,343,199~4.3 million. So the average stay in hospital for cancer is approximately 4.3/1.4=3.1 days.
The graph below shows the number of stays in national health service hospitals in England by diagnosis and sex in 2002/3.
The table below shows the actual number of days in hospital for the same data.
|
Main diagnosis |
Days in hospital |
| Diseases of the circulatory system |
7,625,301 |
|
Diabetes |
368,780 |
| Cancer |
4,343,199 |
|
Diseases of the nervous system |
1,742,156 |
| Diseases of the respiratory system |
3,892,460 |
|
Diseases of the digestive system |
3,533,337 |
| Diseases of the genitourinary system |
2,207,105 |
|
Complications of pregnancy and childbirth |
1,988,492 |
| Injury and poisoning |
4,954,304 |
|
All other diagnoses |
21,781,029 |
| All diagnoses |
52,436,163 |
Explanation
The correct answer is A.
There are approximately 1.4 million episodes of care for cancer, so 1.4×1/7=0.2 million of these would have been for lung cancer. The incidence of lung cancer among men is 50% higher than for women, so the ratio of lung cancer men:women would be 1.5:1=3:2. So the number of episodes of care of lung cancer for men would be: 0.2x(⅗)=0.12 million, or 0.12×1000000=120000.
The graph below shows the number of stays in national health service hospitals in England by diagnosis and sex in 2002/3.
The table below shows the actual number of days in hospital for the same data.
|
Main diagnosis |
Days in hospital |
| Diseases of the circulatory system |
7,625,301 |
|
Diabetes |
368,780 |
| Cancer |
4,343,199 |
|
Diseases of the nervous system |
1,742,156 |
| Diseases of the respiratory system |
3,892,460 |
|
Diseases of the digestive system |
3,533,337 |
| Diseases of the genitourinary system |
2,207,105 |
|
Complications of pregnancy and childbirth |
1,988,492 |
| Injury and poisoning |
4,954,304 |
|
All other diagnoses |
21,781,029 |
| All diagnoses |
52,436,163 |
Explanation
The correct answer is A & C.
B cannot be a contributing factor because more episodes of care does not mean longer stays in hospital, but rather an increased number of stays in hospital. D similarly is irrelevant because increased mortality rate does not mean hospital stays are longer (it may actually shorten hospital stays because people die sooner after being admitted to hospital). However A and C both directly relate to the length of stay in hospital, therefore only A and C apply.
The score in a quiz game is calculated as follows:
|
Correct answer |
3 points |
| No answer |
0 points |
|
Incorrect answer |
-1 point. |
The quiz consists of 12 questions and John scores 18 points.
Explanation
The correct answer is B & C.
Going through each of the options A-E:
A – If he gave 5 correct answers he could not have scored more than 3×5=15 points, so he could not have given only 5 correct answers.
B – If he gave 6 correct answers he could not have scored more than 3×6=18 points. To keep the score of 18, he could have given no answer for the remainder of the questions. So he could have given exactly 6 correct answers.
C – If he gave 7 correct answers he could not have scored more than 3×7=21 points. To get a score of 18, he could have got 3 of the remaining 5 answers wrong and given no answer for the remaining 2 questions. So he could have given exactly 7 correct answers.
D – If he gave 8 correct answers he could not have scored more than 3×8=24 points. There is no possible way to get a score of 18 from the remaining 4 questions, as even if he got all 4 questions wrong the lowest possible score he could get would be 20. So he could not have given exactly 8 correct answers.
E – Similar to the explanation for D, he could not have given exactly 9 correct answers.
Very conveniently, from an evolutionary standpoint, water freezes with its molecules bonding to form a very open lattice. This unusual structure is such that the density of water ice is less than that of liquid water, which is why ice floats, unlike other solids with tighter structures such as iron. (An iron bar placed in molten iron will sink.) Where and when the oceans freeze, ice forms a layer of insulation on the surface which holds in the heat of the liquid below. Without this protection the seas would freeze solid, from the bottom up; and life as we know it, which began in water, would not exist.
Explanation
The correct answer is B.
‘Without this protection the seas would freeze solid, from the bottom up; and life as we know it, which began in water, would not exist.’ This shows that we need water for life, so water is a necessary condition for life.
For the structure of water to also be a sufficient condition for life, the passage must explain how life can exist with water as its only essential condition. But this is not suggested by the information given, so water’s structure is a necessary but not sufficient condition for life as we know it.
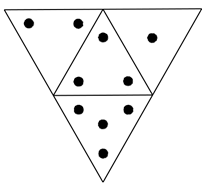
The diagram alongside shows a flat piece of cardboard that may be folded to make a tetrahedral (pyramidal) die.
Explanation
The correct answer is B.
Try drawing the net on some paper/card, folding it up and rotating it in order to confirm that the only possible view is B.
The use of animals for experiments for medical research has been criticised by many animal rights campaigners as morally wrong. Some campaigners use extreme tactics to gain public attention. But they ignore the many benefits which advances in medicine have for animals themselves. The development of antibiotics, for example, has helped animals as well as humans. If the animal population as a whole derives benefit from experiments on only a small minority of animals, those experiments are morally acceptable.
Explanation
The correct answer is D.
The conclusion here refers to the final sentence in the paragraph. Experiments should only be conducted on a small number of animals if the outcome of those experiments results in a benefit to the entire animal population. Hence, animal experiments are only deemed acceptable if beneficial to animals and humans, as statement D refers to.
Annie, Barbara, Colin and David all attend regular clinics where they are encouraged to lose weight.
At the beginning of the year, they weighed 65, 80, 75 and 70 kg respectively. During the year, all had a change in weight of more than 5 kg. Colin lost more than either Barbara or Annie. David actually put on weight.
Explanation
The correct answer is A.
Colin, Barbara and Annie all lost more than 5kg, so their weights will be below 70, 75 and 60 respectively. David put on more than 5kg, so his weight will be over 75kg. So A cannot be a possible increasing order of their weights because Colin lost more than Barbara and initially weighed less, so Colin must now weigh less than Barbara.
The worst of what ensued when the Exxon Valdez spilled 40,000 tons of crude oil into Alaska’s coastal waters in 1989 is not that it was the most damaging oil spill in history but that it isn’t yet history. Despite the intense research on the ecosystem, this 10,000-square-mile tapestry of icefields, mountains, forests and sea is far from recovered. Lingering and unanticipated injuries abound. A 2001 study found more than 100 tons of toxic oil remaining on dozens of the beaches, oil that seeps out with every tide, and that – because incomplete weathering left behind higher concentrations of toxins – is even more poisonous now than when it gushed from the ripped tanker. This oil will remain on these beaches for decades to come.
[Adapted from: The Lingering Lessons of the EV, by Marybeth Holleman. Ecologist: May 2004. p 12]
Explanation
The correct answer is A.
The conclusion here is statement A because the paragraph explains that the damage caused by the oil spill is not yet history, meaning that the repercussions of the oil spill are yet to be seen, which best summarises the argument raised in the paragraph.
Statement D is similar to A, however, it does not summarise the paragraph as well as statement A does.
Statements B and E are true but support statement A rather than representing the overarching conclusion.
The rate of reaction between marble and acid can be greatly increased by crushing marble chips into powdered form. This is because of the larger total surface area of marble that is exposed to the acid.
Explanation
The correct answer is C.
The surface area of a cube with dimensions of 1cm is 1x1x6=6cm², or 6×10²=600mm². It’s volume would be 1x1x1=1cm³, or 1×10³=1000mm³.
The volume of a 0.1mm dimension cube would be 0.1×0.1×0.1=0.001mm³. So the number of smaller cubes that would be made by crushing the larger cube would be 1000/0.001=1000000. The surface area of a single 0.1mm dimension cube is 0.1×0.1×6=0.06mm². So the total surface area of these 1000000 smaller cubes would be 1000000×0.06=60000mm². So the increase in surface area by crushing the cubes would be 60000-600=59400mm² or 59400/(10²)=594cm²
Increases in blood pressure associated with old age are endemic in developed countries, but are rarely seen in underdeveloped countries where people tend to maintain a high level of physical activity throughout their lives. At the other end of the age-range, obesity and diabetes are more common among young people in developed countries, where largely sedentary lifestyles give limited opportunity for exercise.
Explanation
The correct answer is D.
The conclusion here is statement D because best summarises the points being raised about sedentary lifestyles / lifestyles with less physical activity correlated with higher rates diseases like high blood pressure, diabetes and obesity irregardless of age group.
 Asab
Medicmind Tutor
Asab
Medicmind Tutor
Sat, 08 Oct 2022 13:13:11
why doesn't A fit as the answer?
The table below shows the results of a survey into salt intake as estimated by measuring urinary sodium levels. The results are expressed cumulatively. The recommended maximum daily intake of salt is 6 grams.
Daily salt consumption estimated from total urinary sodium by sex and age, 2000/01, Great Britain
|
|
MEN | WOMEN | ||||||||||
| Salt consumption | 19-24 | 25-34 | 35-49 | 50-64 | All | 19-24 | 25-34 | 35-49 | 50-64 |
All |
||
|
(grams per day) |
cum % | cum % | cum % | cum % | cum % | cum % | cum % | cum % | cum % | cum % | ||
| 3 or less | – | 5 | 2 | 5 | 4 | 4 | 6 | 5 | 7 |
6 |
||
|
6 or less |
2 | 20 | 13 | 18 | 15 | 17 | 29 | 31 | 38 | 31 | ||
| 9 or less | 37 | 34 | 39 | 42 | 39 | 66 | 59 | 68 | 69 |
66 |
||
|
12 or less |
60 | 57 | 58 | 65 | 60 | 84 | 81 | 85 | 91 | 86 | ||
|
15 or less |
81 | 73 | 80 | 83 | 79 | 90 | 92 | 96 | 96 |
95 |
||
| 18 or less | 100 | 89 | 91 | 91 | 91 | 92 | 97 | 100 | 99 |
98 |
||
|
Mean |
11.0 | 11.4 | 11.1 | 10.5 | 11.0 | 9.1 | 8.7 | 8.0 | 7.5 | 8.1 | ||
| Number in survey | 62 | 152 | 170 | 183 | 567 | 60 | 129 | 203 | 187 |
580 |
||
Notes: Respondents who reported making a full 24-hour urine collection.
Source: Office for National Statistics (2003) The National Diet and Nutrition survey: adults aged 19 to 64 years.
Volume 3. Vitamin and mineral intake and urinary analysis, The Stationery Office: London.
Explanation
The correct answer is D.
The maximum recommended daily intake is 6g, so we need to look at the percentages given in the ‘all’ column for men, in the row labelled ‘6 or less’ (we do not need to include the percentage for ‘3 or less’ because the table gives the cumulative percentages). This value is 15%. The number in the survey is given at the bottom of the same column as 567, so the number of men who had equal to or less than 6g of salt per day was: 567×0.15~570×0.15=85.5=86 men.
The table below shows the results of a survey into salt intake as estimated by measuring urinary sodium levels. The results are expressed cumulatively. The recommended maximum daily intake of salt is 6 grams.
Daily salt consumption estimated from total urinary sodium by sex and age, 2000/01, Great Britain
|
|
MEN | WOMEN | ||||||||||
| Salt consumption | 19-24 | 25-34 | 35-49 | 50-64 | All | 19-24 | 25-34 | 35-49 | 50-64 |
All |
||
|
(grams per day) |
cum % | cum % | cum % | cum % | cum % | cum % | cum % | cum % | cum % | cum % | ||
| 3 or less | – | 5 | 2 | 5 | 4 | 4 | 6 | 5 | 7 |
6 |
||
|
6 or less |
2 | 20 | 13 | 18 | 15 | 17 | 29 | 31 | 38 | 31 | ||
| 9 or less | 37 | 34 | 39 | 42 | 39 | 66 | 59 | 68 | 69 |
66 |
||
|
12 or less |
60 | 57 | 58 | 65 | 60 | 84 | 81 | 85 | 91 | 86 | ||
|
15 or less |
81 | 73 | 80 | 83 | 79 | 90 | 92 | 96 | 96 |
95 |
||
| 18 or less | 100 | 89 | 91 | 91 | 91 | 92 | 97 | 100 | 99 |
98 |
||
|
Mean |
11.0 | 11.4 | 11.1 | 10.5 | 11.0 | 9.1 | 8.7 | 8.0 | 7.5 | 8.1 | ||
| Number in survey | 62 | 152 | 170 | 183 | 567 | 60 | 129 | 203 | 187 |
580 |
||
Notes: Respondents who reported making a full 24-hour urine collection.
Source: Office for National Statistics (2003) The National Diet and Nutrition survey: adults aged 19 to 64 years.
Volume 3. Vitamin and mineral intake and urinary analysis, The Stationery Office: London.
Explanation
The correct answer is B.
Looking in the ‘all’ column for women, we can see that the cumulative percentage of 50% would lie between the cumulative percentages of 31% and 66%, representing women’s salt consumption of 6g or less and 9g or less respectively. So we know the median salt consumption lies somewhere between 6 and 9g. To find the median salt consumption:
66-31=35%, so 35% of women are in the ‘9g or less group’.
66-50=16%
The difference in salt consumption between the groups is 9-6=3g.
(16/35)x3=1.4g
9-1.4=7.6g.
So the median salt consumption for women is 7.6g per day.
The table below shows the results of a survey into salt intake as estimated by measuring urinary sodium levels. The results are expressed cumulatively. The recommended maximum daily intake of salt is 6 grams.
Daily salt consumption estimated from total urinary sodium by sex and age, 2000/01, Great Britain
|
|
MEN | WOMEN | ||||||||||
| Salt consumption | 19-24 | 25-34 | 35-49 | 50-64 | All | 19-24 | 25-34 | 35-49 | 50-64 |
All |
||
|
(grams per day) |
cum % | cum % | cum % | cum % | cum % | cum % | cum % | cum % | cum % | cum % | ||
| 3 or less | – | 5 | 2 | 5 | 4 | 4 | 6 | 5 | 7 |
6 |
||
|
6 or less |
2 | 20 | 13 | 18 | 15 | 17 | 29 | 31 | 38 | 31 | ||
| 9 or less | 37 | 34 | 39 | 42 | 39 | 66 | 59 | 68 | 69 |
66 |
||
|
12 or less |
60 | 57 | 58 | 65 | 60 | 84 | 81 | 85 | 91 | 86 | ||
|
15 or less |
81 | 73 | 80 | 83 | 79 | 90 | 92 | 96 | 96 |
95 |
||
| 18 or less | 100 | 89 | 91 | 91 | 91 | 92 | 97 | 100 | 99 |
98 |
||
|
Mean |
11.0 | 11.4 | 11.1 | 10.5 | 11.0 | 9.1 | 8.7 | 8.0 | 7.5 | 8.1 | ||
| Number in survey | 62 | 152 | 170 | 183 | 567 | 60 | 129 | 203 | 187 |
580 |
||
Notes: Respondents who reported making a full 24-hour urine collection.
Source: Office for National Statistics (2003) The National Diet and Nutrition survey: adults aged 19 to 64 years.
Volume 3. Vitamin and mineral intake and urinary analysis, The Stationery Office: London.
Explanation
The correct answer is A.
For salt consumption, the percentage of men falling into each category is:
3-6 = 4
6-9 = 15-4=11
9-12= 39-15=24
12-15 = 60-39=21
15-18 = 79-60=19
18+ = 91-79=12.
Hence, the tallest bar should be for the ‘6-9’ category, so eliminate B and D. The smallest bar should be for the 3-6 category, so eliminate C.
Therefore A is the correct graph.
The table below shows the results of a survey into salt intake as estimated by measuring urinary sodium levels. The results are expressed cumulatively. The recommended maximum daily intake of salt is 6 grams.
Daily salt consumption estimated from total urinary sodium by sex and age, 2000/01, Great Britain
|
|
MEN | WOMEN | ||||||||||
| Salt consumption | 19-24 | 25-34 | 35-49 | 50-64 | All | 19-24 | 25-34 | 35-49 | 50-64 |
All |
||
|
(grams per day) |
cum % | cum % | cum % | cum % | cum % | cum % | cum % | cum % | cum % | cum % | ||
| 3 or less | – | 5 | 2 | 5 | 4 | 4 | 6 | 5 | 7 |
6 |
||
|
6 or less |
2 | 20 | 13 | 18 | 15 | 17 | 29 | 31 | 38 | 31 | ||
| 9 or less | 37 | 34 | 39 | 42 | 39 | 66 | 59 | 68 | 69 |
66 |
||
|
12 or less |
60 | 57 | 58 | 65 | 60 | 84 | 81 | 85 | 91 | 86 | ||
|
15 or less |
81 | 73 | 80 | 83 | 79 | 90 | 92 | 96 | 96 |
95 |
||
| 18 or less | 100 | 89 | 91 | 91 | 91 | 92 | 97 | 100 | 99 |
98 |
||
|
Mean |
11.0 | 11.4 | 11.1 | 10.5 | 11.0 | 9.1 | 8.7 | 8.0 | 7.5 | 8.1 | ||
| Number in survey | 62 | 152 | 170 | 183 | 567 | 60 | 129 | 203 | 187 |
580 |
||
Notes: Respondents who reported making a full 24-hour urine collection.
Source: Office for National Statistics (2003) The National Diet and Nutrition survey: adults aged 19 to 64 years.
Volume 3. Vitamin and mineral intake and urinary analysis, The Stationery Office: London.
Explanation
The correct answer is B.
We know that a certain percentage of each age range falls into each category of salt consumption. But each category for salt consumption is a range, and we do not know where each person’s salt consumption falls within each range. Therefore B gives a possible explanation of why figures may be biased.
A doctor’s surgery lasts from 9 am to 11 am. The appointments system allows her 5 minutes per patient. 20 minutes is kept free at the end of the surgery for emergency appointments. On a particular morning the doctor arrives late. 20 patients have been booked for routine appointments, but 2 do not attend. 1 patient takes 12 minutes to see, but the rest are given the normal 5 minutes. An urgent phone call takes 8 minutes. Surgery was completed at 11 am despite a 5 minute emergency appointment.
Explanation
The correct answer is B.
20 patients were booked in for routine appointments but only 20-2=18 attended. 17 of these took the usual 5 minutes but 1 lasted 12 minutes, so they took (15×5)+12=97 minutes in total. In addition there was a 8 minute phone call and 5 minute emergency appointment, taking the total time to: 97+8+5=110minutes=1 hr and 50 minutes. Working backwards from when surgery finished at 11am, the appointments must have begun at 9:10am. Therefore the doctor was 10 minutes late.
Gardeners are being encouraged to use alternatives to peat, as peat harvesting endangers the wetland habitats of wading birds. But gardening has become the most popular hobby in the UK, with thousands of people visiting garden centres to buy – among other things – peat-based compost. The habitats of wading birds will therefore inevitably decline if gardening continues to be so popular.
Explanation
The correct answer is B.
The conclusion here is that the habitats of wading birds will inevitably decline and this is due to peat. However, we are assuming that although there are alternatives to peat gardeners will keep using peat.
Two lighthouses can be seen from the sea-front at Shoreton. Both lights switch on and off in regular repeating patterns. One is on for 3 seconds then off for 8 seconds, whilst the other is on for 2 seconds then off for 7 seconds.
15 seconds ago both lights became visible at precisely the same moment.
Explanation
The correct answer is A.
Going through each of the options A-E starting with the smallest:
A – in 15+32=47 seconds from when the lights both became visible together, the first light would be 47-3-8-3-8-3-8-3=0 just disappearing from view, as it would have just completed its last 3 seconds of being on. The second light would be 47-2-7-2-7-2-7-2-7-2-7-2=0 just disappearing from view as well, as it would have just completed its last 2 seconds of being on.
Therefore both lights will disappear from view in 32 seconds from ‘now’.
An open cylindrical container made from sheet metal of uniform thickness has a mass of 800 g. When completely filled with water the total mass is 15.6 kg.
Explanation
The correct answer is B.
The mass of water in a full container would be 15.6-0.8=14.8kg. If the diameter and height of the container were doubled, looking at the formula for the volume of a cylinder r2h, we can see that r and h would be doubled, so the volume of water would be increased by a factor of (2^2)x2=8. As mass is proportional to volume, the mass of the water would also increase by a factor of 8 to 14.8×8=118.4kg.
Looking at the formulae for the surface area of an open cylinder r2+2rh, we can see that doubling the diameter would double r and h in the equation, which would quadruple the r2part (because r is being squared) and also quadruple the 2rh part (because r and h are being multiplied by each other). Therefore the surface area of the container and hence the mass would be quadrupled: 0.8×4=3.2kg.
So the total mass of the larger container would be 118.4+3.2=121.6kg.
LordBird50
Medicmind Tutor
Mon, 30 Sep 2024 20:14:35
r2h makes 6 tho?
Doctors in Great Britain can work for the public health service, a commercial service, or both. 30% of doctors in Great Britain work, at least some of the time, for the commercial sector. On the basis of this information alone, deduce which of the following statements are true of doctors in Great Britain.
1. Some doctors work only in the public health service.
2. More doctors work in the public health service than the commercial sector.
3. Some doctors spend more time on commercial work than in the public health service.
Explanation
The correct answer is C.
If 30% of doctors in Great Britain work, at least some of the time, for the commercial sector, then the remaining 70% must not work in the commercial sector at any time. Given that doctors must work for at least one of the public health service or the commercial sector, the remaining 70% must work in the public health sector only, so statements 1 and 2 must be true.
The information in the passage tells us what proportion of doctors work in each sector, but gives no indication of the length of time spent working in each, therefore statement 3 cannot be concluded from the information given.
Hence only statements 1 and 2 are true.
Nathan pours 250 ml of sodium chloride solution into a beaker from a bottle labelled “concentration 30 g/l”. He accidentally spills 50 ml and decides to replace it, but inadvertently tops up the beaker with 50 ml from a different bottle, this one labelled “concentration 20 g/l”.
Explanation
The correct answer is E.
He spills 50ml of 250ml of 30g/l solution, so he now has 250-50=200ml of this solution, which would contain 30×200/1000=6g of NaCl. The 50ml of 20g/l solution he then adds would contain 20×50/1000=1g of NaCl. So in his beaker, there would now be 6+1=7g of NaCl, in a total volume of 250ml, so the concentration would be 7/(250/1000)=7/0.25=28g/l.
A runner and a cyclist are having a race. The course (in order) includes a flat section of 1 km, a muddy section of 1.5 km, an uphill section of 500 m and a downhill section of 1 km.
The speeds they achieve on each section of the course are as follows:
|
|
Flat | Mud | Uphill | Downhill |
|
Runner |
6 km/hr | 4 km/hr | 3 km/hr |
8 km/hr |
| Cyclist | 30 km/hr | 3 km/hr | 2 km/hr |
40 km/hr |
Explanation
The correct answer is B.
The 1km flat section is first, and the cyclist will be faster on this section, so will be in the lead initially, so eliminate graphs in which the runner is in the lead first: graphs A and D.
In the second section of the race, the course is muddy, so the runner will have a greater speed than the cyclist. So the lead by the cyclist would decrease for the next 1.5km, eliminate E because at 2km into the race (where there is still 0.5km of the muddy section left) the rate of change in difference between the leads of the runner and the cyclist changes (i.e the gradient of the graph changes).
The next 0.5km is uphill, in which the runner will have a greater speed. But the relative difference between the runner’s and cyclist’s speeds would be greater, so the rate of increase in the lead of the runner would be greater (the graph would be steeper) between 2.5 and 3km. This is only shown by graph B, which is the correct answer.
Which two of these statements are equivalent?
Explanation
The correct answer is A & C.
If Anne is not older than Susan, Anne must be younger than or equal to Susan’s age. Therefore Susan must be the same age as or older than Anne. Hence statements A and C are equivalent.
In the United States, the number of serious auto accidents is declining. Countrywide, between 1980 and 1993, auto accident fatalities fell from 51,091 to 40,115, and property claims per 100 insured vehicles fell from 4.94 to 4.00, a decrease of 19 per cent. Credit for this remarkable improvement must go to the efforts of federal and state regulators to reduce automobile accidents and increase passenger safely. Laws mandating the wearing of seatbelts, the installation of airbags, a more robust construction of the car body, enhanced vehicle safety standards, better road design, and campaigns against drunk driving have all helped.
Despite these impressive improvements in road safety, however, Americans now make more claims for bodily injury, referred to as BI. Between 1980 and 1993, the number of BI claims per 100 insured vehicles rose 33 per cent to 29.3, and the likelihood of a BI claim being filed in an accident that involved a property damage claim rose 64 per cent in the same time period.
The ‘whippies’, as the insurance industry calls whiplash claimants, account for this huge increase in BI claims. For the purpose of insurance statistics, whiplash is recorded as “sprains and strains,” and since these sprains and strains nearly all involve the neck and the back, it is reasonable to equate them with whiplash. From 1987 to 1992, claims in the US for sprains and strains increased in proportion to other injuries. In 1987, 75 per cent of BI claims were for sprains and strains, and 45 per cent for “all other injuries.” By 1992 sprains and strains had risen to 83 per cent, and all other injuries had fallen to 40 per cent. This trend is no isolated oddity, for similar changes have happened elsewhere. In Japan annual collision deaths peaked at 4900 in 1993 and fell to little over 4200 by 1997, while over the same period the number of whiplash claims rose from 228,000 to 252,000.
[Source: Whiplash and other useful injuries, Andrew Malleson. McGill Queens University Press, Montreal. p 254.]
Explanation
The correct answer is B.
(4900-4200)/4900=0.14=14%.
In the United States, the number of serious auto accidents is declining. Countrywide, between 1980 and 1993, auto accident fatalities fell from 51,091 to 40,115, and property claims per 100 insured vehicles fell from 4.94 to 4.00, a decrease of 19 per cent. Credit for this remarkable improvement must go to the efforts of federal and state regulators to reduce automobile accidents and increase passenger safely. Laws mandating the wearing of seatbelts, the installation of airbags, a more robust construction of the car body, enhanced vehicle safety standards, better road design, and campaigns against drunk driving have all helped.
Despite these impressive improvements in road safety, however, Americans now make more claims for bodily injury, referred to as BI. Between 1980 and 1993, the number of BI claims per 100 insured vehicles rose 33 per cent to 29.3, and the likelihood of a BI claim being filed in an accident that involved a property damage claim rose 64 per cent in the same time period.
The ‘whippies’, as the insurance industry calls whiplash claimants, account for this huge increase in BI claims. For the purpose of insurance statistics, whiplash is recorded as “sprains and strains,” and since these sprains and strains nearly all involve the neck and the back, it is reasonable to equate them with whiplash. From 1987 to 1992, claims in the US for sprains and strains increased in proportion to other injuries. In 1987, 75 per cent of BI claims were for sprains and strains, and 45 per cent for “all other injuries.” By 1992 sprains and strains had risen to 83 per cent, and all other injuries had fallen to 40 per cent. This trend is no isolated oddity, for similar changes have happened elsewhere. In Japan annual collision deaths peaked at 4900 in 1993 and fell to little over 4200 by 1997, while over the same period the number of whiplash claims rose from 228,000 to 252,000.
[Source: Whiplash and other useful injuries, Andrew Malleson. McGill Queens University Press, Montreal. p 254.]
Explanation
The correct answer is B.
In 1987, 75 per cent of BI claims were for sprains and strains, and 45 per cent for “all other injuries.”’ Clearly, 75+45% is greater than 100%, which is impossible. But if some of the claims for sprains and strains were for all other injuries as well, this would no longer be puzzling. Hence the answer is B.
In the United States, the number of serious auto accidents is declining. Countrywide, between 1980 and 1993, auto accident fatalities fell from 51,091 to 40,115, and property claims per 100 insured vehicles fell from 4.94 to 4.00, a decrease of 19 per cent. Credit for this remarkable improvement must go to the efforts of federal and state regulators to reduce automobile accidents and increase passenger safely. Laws mandating the wearing of seatbelts, the installation of airbags, a more robust construction of the car body, enhanced vehicle safety standards, better road design, and campaigns against drunk driving have all helped.
Despite these impressive improvements in road safety, however, Americans now make more claims for bodily injury, referred to as BI. Between 1980 and 1993, the number of BI claims per 100 insured vehicles rose 33 per cent to 29.3, and the likelihood of a BI claim being filed in an accident that involved a property damage claim rose 64 per cent in the same time period.
The ‘whippies’, as the insurance industry calls whiplash claimants, account for this huge increase in BI claims. For the purpose of insurance statistics, whiplash is recorded as “sprains and strains,” and since these sprains and strains nearly all involve the neck and the back, it is reasonable to equate them with whiplash. From 1987 to 1992, claims in the US for sprains and strains increased in proportion to other injuries. In 1987, 75 per cent of BI claims were for sprains and strains, and 45 per cent for “all other injuries.” By 1992 sprains and strains had risen to 83 per cent, and all other injuries had fallen to 40 per cent. This trend is no isolated oddity, for similar changes have happened elsewhere. In Japan annual collision deaths peaked at 4900 in 1993 and fell to little over 4200 by 1997, while over the same period the number of whiplash claims rose from 228,000 to 252,000.
[Source: Whiplash and other useful injuries, Andrew Malleson. McGill Queens University Press, Montreal. p 254.]
Explanation
The correct answer is B.
Using data from the second paragraph: 29.3/1.33=22.
In the United States, the number of serious auto accidents is declining. Countrywide, between 1980 and 1993, auto accident fatalities fell from 51,091 to 40,115, and property claims per 100 insured vehicles fell from 4.94 to 4.00, a decrease of 19 per cent. Credit for this remarkable improvement must go to the efforts of federal and state regulators to reduce automobile accidents and increase passenger safely. Laws mandating the wearing of seatbelts, the installation of airbags, a more robust construction of the car body, enhanced vehicle safety standards, better road design, and campaigns against drunk driving have all helped.
Despite these impressive improvements in road safety, however, Americans now make more claims for bodily injury, referred to as BI. Between 1980 and 1993, the number of BI claims per 100 insured vehicles rose 33 per cent to 29.3, and the likelihood of a BI claim being filed in an accident that involved a property damage claim rose 64 per cent in the same time period.
The ‘whippies’, as the insurance industry calls whiplash claimants, account for this huge increase in BI claims. For the purpose of insurance statistics, whiplash is recorded as “sprains and strains,” and since these sprains and strains nearly all involve the neck and the back, it is reasonable to equate them with whiplash. From 1987 to 1992, claims in the US for sprains and strains increased in proportion to other injuries. In 1987, 75 per cent of BI claims were for sprains and strains, and 45 per cent for “all other injuries.” By 1992 sprains and strains had risen to 83 per cent, and all other injuries had fallen to 40 per cent. This trend is no isolated oddity, for similar changes have happened elsewhere. In Japan annual collision deaths peaked at 4900 in 1993 and fell to little over 4200 by 1997, while over the same period the number of whiplash claims rose from 228,000 to 252,000.
[Source: Whiplash and other useful injuries, Andrew Malleson. McGill Queens University Press, Montreal. p 254.]
Explanation
The correct answer is B & C.
The anomaly can be recognised by looking at the sentence at the beginning of paragraphs 1 and 2 (respectively): ‘In the United States, the number of serious auto accidents is declining.’ ‘However, Americans now make more claims for bodily injury’.
If doctors were unsure if whiplash was a ‘real’ condition or not, the number of strains and sprains reported may actually be less than the true value, so A cannot offer any explanation for the anomaly.
If ‘many lawyers have introduced a no-win-no-fee service to claimants seeking compensation for personal injury’, more people would seek and hence may earn compensation for personal injury than they did in the past, so B could be a possible explanation.
If ‘the severity of strains and sprains is difficult to assess whereas damage to a vehicle is directly observable ‘, people could exaggerate the extent of their strains/sprains or lie about having them, whereas they could not do this for vehicle damage. Therefore C could also be a possible explanation
BMAT 2004 S1 Review Screen
Instructions
Below is a summary of your answers. You can review your questions in three (3) different ways.
The buttons in the lower right-hand corner correspond to these choices:
1. Review all of your questions and answers.
2. Review questions that are incomplete.
3. Review questions that are flagged for review. (Click the 'flag' icon to change the flag for review status.)
You may also click on a question number to link directly to its location in the exam.
BMAT 2004 S1 Section
Final Answer Review Screen
Instructions
This review section allows you to view the answers you made and see whether they were correct or not. Each question accessed from this screen has an 'Explain Answer' button in the top left hand side. By clicking on this you will obtain an explanation as to the correct answer.
At the bottom of this screen you can choose to 'Review All' answers, 'Review Incorrect' answers or 'Review Flagged' answers. Alternatively you can go to specific questions by opening up any of the sub-tests below.
BMAT 2004 S1 Section
TI-108
Sat, 18 Sep 2021 17:43:34
How can C not be made from 4 identical triangles? I thought it would be E as in order for it not to be possible to be made, the triangles would have to be of different sizes- hence not identical.