This section is Section 1 of 3.

Speed as well as accuracy is important in this section. Work quickly, or you might not finish the paper. There are no penalties for incorrect responses, only marks for correct answers, so you should attempt all 35 questions. Each question is worth one mark.

You must complete the answers within the time limit. Calculators are NOT permitted.

Good Luck!

Note – if press “End Exam” you can access full worked solutions for all past paper questions

Some Malgons are Zanders and all Zanders are Tvints.

1. Which one of the following statements is definitely true?
  • 0
    0

    Explanation

    The correct answer is D.

    Post Comment

    Simplistic interpretations of traditional evolutionary theory suggest that animals are never altruistic (selfless). In other words their only compelling drive is for personal survival. There are, however, examples in the animal kingdom of “reciprocal altruism”, when an altruistic act is carried out, which may be returned at another time. Warning calls by a bird, for example, put the bird at higher personal risk, but the bird will benefit in the long run if others reciprocate. In this case, “altruism” has clear paybacks for the bird.

    2. Which of the following could be drawn as a conclusion from the passage above?
  • 0
    0

    Explanation

    The correct answer is C.

    Statement C is correct because traditional evolutionary theory states that an animal’s ‘only compelling drive is for personal survival.’ However, reciprocal altruism is not truly selfless and is therefore compatible with traditional evolutionary theory.

    Statement A is incorrect because there is no mention of humans in the paragraph.

    Statement B is also incorrect because there is no mention of further information potentially discrediting the traditional evolutionary theory.

    Statement D is incorrect because it cannot be deduced that birds function as social groups from the warning calls they produce to warn other birds.

    Statement E is also incorrect as there is no mention how selflessness in the animal kingdom contradicts ‘survival of the fittest’. This is a classic example whereby presumed prior knowledge should not be used to supplement coming to an answer. Only use the information given in the paragraph.

    Post Comment

    Jim has all his screws jumbled up in a big jar. The number of screws it contains is as follows:

    Length
    25 mm 35 mm

    45 mm

    Diameter

    3 mm 68 10 2
    4 mm 22 20

    18

    5 mm 10 54

    46

    3. He needs a 4 mm screw but doesn’t mind whether it is 35 or 45 mm long. If he takes one out at random, what are the chances that it will suit his purpose? (Answer to the nearest 1 %)
  • 0
    0

    Explanation

    The correct answer is B.

    There are 20 35mm long screws and 18 40mm long screws that have a diameter of 4mm. So 20+18=38 screws are suitable out of the 68+10+2+22+38+10+54+46=250 screws in the jar. So the probability he picks a suitable screw is 38/250=152/1000=15.2%

    Post Comment

    It is often claimed that the use of animals in medical research is justified by the fact that such use has been involved in the major discoveries of drugs to treat serious and fatal illnesses. But the law requires that new drugs are tested on animals for effectiveness and safety, so, of course, every new wonder-drug involves the use of animals at some stage. Thus to claim that the very fact of animal testing proves the value of using animals in medical research is as nonsensical as claiming that wearing lab coats whilst doing experiments proves the value of lab coats in finding new cures. The important question in relation to animal experiments is, therefore, whether they are crucial in providing the necessary weight of evidence on effectiveness and safety of drugs, not ___________________________

    4. Which one of the following most logically completes the above argument?
  • 0
    0

    Explanation

    The correct answer is A.

    The argument is that whether the use of animals in medical research is vital is questionable and that their use is only justified if it helps provide evidence of the effectiveness and safety of the drugs being tested. We can see that answer A most logically completes the argument by looking at the comparison of the use of animals to wearing labcoats: labcoats may have been worn when new drugs are discovered, but that does not necessarily mean they were crucial in the process.

    Post Comment

    I played a game at a friend’s house yesterday that involved throwing a pair of dice. When I threw them for my first turn they landed as follows:

    It was clear they were not identical. On my second turn they landed like this:

    Now I could see that there was something very odd about them. Closer inspection revealed that one of them was a conventional die (with opposite faces totalling seven), whilst the other one appeared to have had its faces numbered from one to six unconventionally.

    5. What number is on the opposite face to two on the “unconventional die”?
  • 0
    0

    Explanation

    The correct answer is E.

    On the unconventional die (right), we have been shown the numbers on all the faces adjacent to the face with 6 dots, which have 3, 5, 1 and 4 dots. Therefore the only remaining face, opposite the face with 6 dots, must have 2 dots.

    Post Comment

    1. 45 – 54 year old men might be using other digital applications.

    2. Evidence from a single survey is insufficient to show that a gap is growing.

    3. Surveys can be misleading if they are taken from unrepresentative samples.

    6. Which of the following express(es) why the headline does not accurately reflect the evidence provided by the survey?
  • 0
    0

    Explanation

    The correct answer is D.

    Statement 1 is correct because the survey could have been conducted on males aged 45-54 that use different digital applications than those that were questioned in the survey.

    Statement 2 is also correct because a single survey cannot accurately reflect that there truly is a growing digital divide between the 15-19 and 45-54 age groups. Several studies may be needed to support this argument.

    Statement 3 is incorrect because there is no evidence to show that the evidence was not based on a representative sample.

    Post Comment

    My rectangular patio is 5 m long and 4 m wide. It is covered with white tiles, and some black tiles, of three different sizes (60 cm x 60 cm, 60 cm x 40 cm and 40 cm x 40 cm), giving it the following appearance:

    7. What percentage of the area of my patio is black?
  • 0
    0

    Explanation

    The correct answer is D.

    There are 6 60×60 black tiles, which have a total area of 0.6×0.6×6=2.16m^2. There are 6 60×40 black tiles, area=0.6×0.4×6=1.44m^2. There are 2 40×40 black tiles, area=0.4×0.4×2=0.32m^2. Therefore the total area which is black is 2.16+1.44+0.32=3.92m^2. 

    The total area of the patio is 5×4=20m^2. The proportion that is black is 3.92/20=0.196=19.6%

    Post Comment

    12,178 women were questioned about their reproductive history, demography, lifestyle and innate hand preference, and their answers were recorded to provide a “baseline”. The same women were interviewed 16 years later, and the data was used to calculate total person-years lived in the sample.

    The sample comprised 11.6 % left -handed women. Mean age at baseline was similar for left and non-left-handed women: 47.4 and 47.0 years respectively. These groups did not differ in anthropometry, socioeconomic status, smoking habits or family history of breast cancer. The only difference was in child bearing: 21.8 % of left-handed versus 10.9 % of non-left-handed women had borne no children. 426 women from the whole group had breast cancer.

    The non-left-handed group was taken as the reference group. The relative risk for breast cancer in left-handed women compared with non-left-handed women was calculated and was 1.39 overall (see table).

    * in 58 cases information on timing of menopause relative to incidence of breast cancer was not available.

    8. What is the overall percentage increase in risk of breast cancer in left handed women over non-left-handed women?
  • 0
    0

    Explanation

    The correct answer is B (39%).

    (Relative risk of breast cancer for left-handed women – relative risk of breast cancer for non-left-handed women)/ relative risk of breast cancer of non-left-handed women:

    (1.39-1)/1=0.39/1=0.39=39%.

    Post Comment

    12,178 women were questioned about their reproductive history, demography, lifestyle and innate hand preference, and their answers were recorded to provide a “baseline”. The same women were interviewed 16 years later, and the data was used to calculate total person-years lived in the sample.

    The sample comprised 11.6 % left -handed women. Mean age at baseline was similar for left and non-left-handed women: 47.4 and 47.0 years respectively. These groups did not differ in anthropometry, socioeconomic status, smoking habits or family history of breast cancer. The only difference was in child bearing: 21.8 % of left-handed versus 10.9 % of non-left-handed women had borne no children. 426 women from the whole group had breast cancer.

    The non-left-handed group was taken as the reference group. The relative risk for breast cancer in left-handed women compared with non-left-handed women was calculated and was 1.39 overall (see table).

    * in 58 cases information on timing of menopause relative to incidence of breast cancer was not available.

    9. What, from the table, is the incidence of breast cancer in the entire study group expressed as cases per 1000 person-years?
  • 0
    0

    Explanation

    The correct answer is B.

    Sum of cases of breast cancer given in the table/(sum of estimated person years lived/1000)

    =(361+65+57+15+257+39+217+45+144+20+61+9+300+56)/(153+19+32+3+127+18+96+11+57+8+16+4+137+15)

    =1646/696

    =2.4, which is closest to B

    Post Comment

    12,178 women were questioned about their reproductive history, demography, lifestyle and innate hand preference, and their answers were recorded to provide a “baseline”. The same women were interviewed 16 years later, and the data was used to calculate total person-years lived in the sample.

    The sample comprised 11.6 % left -handed women. Mean age at baseline was similar for left and non-left-handed women: 47.4 and 47.0 years respectively. These groups did not differ in anthropometry, socioeconomic status, smoking habits or family history of breast cancer. The only difference was in child bearing: 21.8 % of left-handed versus 10.9 % of non-left-handed women had borne no children. 426 women from the whole group had breast cancer.

    The non-left-handed group was taken as the reference group. The relative risk for breast cancer in left-handed women compared with non-left-handed women was calculated and was 1.39 overall (see table).

    * in 58 cases information on timing of menopause relative to incidence of breast cancer was not available.

    10. What is the incidence of breast cancer per 1000 person-years lived for those having a body mass index of over 25?
  • 0
    0

    Explanation

    The correct answer is A.

    (144+20)/(57+8)

    =164/65

    =2.5

    Post Comment

    12,178 women were questioned about their reproductive history, demography, lifestyle and innate hand preference, and their answers were recorded to provide a “baseline”. The same women were interviewed 16 years later, and the data was used to calculate total person-years lived in the sample.

    The sample comprised 11.6 % left -handed women. Mean age at baseline was similar for left and non-left-handed women: 47.4 and 47.0 years respectively. These groups did not differ in anthropometry, socioeconomic status, smoking habits or family history of breast cancer. The only difference was in child bearing: 21.8 % of left-handed versus 10.9 % of non-left-handed women had borne no children. 426 women from the whole group had breast cancer.

    The non-left-handed group was taken as the reference group. The relative risk for breast cancer in left-handed women compared with non-left-handed women was calculated and was 1.39 overall (see table).

    * in 58 cases information on timing of menopause relative to incidence of breast cancer was not available.

    11. Which one of the following, if true, would be a plausible reason for the apparent increased risk of breast cancer in left-handed women shown by the study?
  • 0
    0

    Explanation

    The correct answer is D.

    The answer needs to explain a difference between left-handed and non-left-handed women that would be responsible for an increased risk of breast cancer amongst left-handed women. Answer A is incorrect as the numbers given for risk are relative. B is irrelevant because the data does not show an increased rate of childbirth amongst left-handed women compared to non-left-handed women. C also does not give an explanation. E may be true, but if the sample is representative of the population of a whole, this should not matter as the proportion of women with breast cancer in each group would be similar.

    Hence, D is the correct answer.

    Post Comment

    Adults all pay the same admission price to watch a football match. There is no charge for children under 16.

    Following record low takings of £1560 at the last match it was decided to reduce the admission price by 25 % this week in an attempt to increase the attendance figures. As a result, exactly 40 % more adults than last time have paid to watch today’s match.

    12. How much has been taken at the gate today?
  • 0
    0

    Explanation

    The correct answer is A.

    1560×0.75×1.4=1638

    Post Comment

    Figures show that, during the course of a year, cars in the UK emit 69.9 million tonnes of CO2, whereas domestic and international flights from the UK emit 37.5 million tonnes. Even though emissions of CO2 at high altitude can be more environmentally damaging than at ground level, cars still make a greater contribution to climate change than do planes. However, the number of people who think that flying is the bigger contributor has risen rapidly in the past eighteen months, a period during which there has been an increase in activity by pressure groups opposed to any growth in air travel. In a National Statistics survey 34 % of those questioned thought that cars contributed more than planes to climate change, while 40 % thought planes contributed more than cars. 47 % thought that air travel should be limited, but only 15 % were willing to fly less often.

    1.Some people’s opinions about the impact of flying on climate change have been influenced by pressure groups.

    2.Some people in the UK are mistaken about the relative contributions of aviation and car travel to climate change.

    3.Some people in the UK who believe that air travel should be limited are not willing to fly less often.

    13. If the statements in the above passage are true, which of the following must also be true?
  • 0
    0

    Explanation

    The correct answer is E.

    Statement 2 is correct because ’34% of those questioned thought that cars contributed more than planes to climate change, while 40% thought planes contributed more than cars.’ Statement 2 is therefore correct as cars emit greater tonnes of carbon dioxide than flights do in the UK during the course of a year. Thus statement 2 is correct as some people (those that were questioned) are mistaken about the proportion of carbon dioxide that flights and cars contribute towards climate change.

    Statement 3 is correct as the final sentence implies that those who are against air travel may however not be willing to fly less often; ’47% thought that air travel should be limited, but only 15% were willing to fly less.’

    Statement 1 is incorrect because the passage simply says that people’s opinions have changed which happened to coincide with increased activity by pressure groups opposed to air travel. It is not stating that opinions were changed due to the pressure groups.

    Post Comment

    The table below shows the all-time top 14 ranked men at 1500m running on the track as at February 2008. When Steve Cram set his time in July 1985, he broke the World Record.

    Rank

    Time Name Date
    1 3:26.00 Hicham El Guerrouj

    14/07/1998

    2

    3:26.34 Bernard Lagat 24/08/2001
    3 3:27.37 Noureddine Morceli

    12/07/1995

    4

    3:28.12 Noah Ngeny 11/08/2000
    5 3:28.95 Fermín Cacho

    13/08/1997

    6

    3:28.98 Mehdi Baala 05/09/2003
    7 3:29.02 Daniel Kipchirchir Komen

    14/07/2006

    8

    3:29.14 Rashid Ramzi 14/07/2006
    9 3:29.18 Vénuste Niyongabo

    22/08/1997

    10

    3:29.29 William Chirchir 24/08/2001
    11 3:29.46 Saïd Aouita

    23/08/1985

    12

    3:29.46 Daniel Komen 16/08/1997
    13 3:29.51 Ali Saïdi-Sief

    04/07/2001

    14

    3:29.67 Steve Cram

    16/07/1985

    14. According to the table above how many other World Record holders have there been since then?
  • 0
    0

    Explanation

    The correct answer is A.

    We need to look at the times of the runners in chronological order, starting from 1985. The first running time less than Steve Cram’s will have broken the record, an after that a new record will be set if the 1500m is run in an even shorter length of time than when the last record was broken. Saïd Aouita was the first person after Steve Cram to break the record, later in 1985. He is followed by Noureddine Morceli who gave an even shorter time in 1995, and then lastly Hicham El Guerrouj in 1998. This means 3 people broke the record after Steve Cram.

    Post Comment

    Radiation from mobile phones is not strong enough to heat biological tissue or break chemical bonds in cells. However, it may affect cell behaviour. Researchers exposed ten female volunteers to radiation at 900 MHz from mobile phones to simulate an hour long phone call. They screened 580 different proteins in their skin cells. They found that the numbers of one protein increased by 89 % in all volunteers. Numbers of a second protein decreased by 32 % in all volunteers. This is the first study to show molecular effects of phone radiation on humans.

    15. Which of the following can reliably be concluded from the evidence in the passage?
  • 0
    0

    Explanation

    The correct answer is D.

    Statement D is correct because the study showed a change in the human body’s reaction to low levels of radiation from mobile phones.

    Statement A is incorrect because the study only looked at a change in two proteins being expressed in the volunteers but there is no evidence to deduce that long term use of phones have a negative effect on human health.

    Statement B is incorrect because there is no mention that low levels of radiation from mobile phones can be negligible to the human body.

    Statement C is incorrect because keeping mobile phone conversations to less than one hour can be deduced from the experiment conducted on the volunteers to simulate a one hour mobile phone conversation.

    Post Comment
    zahra Medicmind Tutor

    Mon, 04 Oct 2021 13:48:39

    isnt statement d and b saying the same thing?

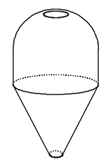
    A farmer has a tank for storing diesel of the form shown below, buried in his farmyard.

    He calculates the volume remaining in the tank using a dipstick which measures the depth of diesel and then referring to a chart. Unfortunately he has calibration charts for several different tanks and is not sure which is his.

    16. Which one of the following best represents the correct calibration chart for the tank?
  • 0
    0

    Explanation

    The correct answer is D.

    As the tank is initially narrow at the bottom and gradually gets wider moving upwards, the increase in depth per unit volume will decrease, so the graph will be getting steeper, which is shown by D and E. Then, the increase in depth per unit volume will be fairly constant as the cylinder-like part of the tank fills. Finally, as the water reaches the top and the tank becomes slightly narrower, the increase in depth per unit increase in volume will increase, so the graph will become less steep, which is shown by graph D.

    Post Comment

    “As one of the millions around the world watching the much anticipated Live Earth concerts, I found myself increasingly irritated by the artists chosen to make us all more aware of the damage we are doing to the environment. Fly less, drive less, waste less, recycle more. Yet these pop stars rack up thousands of miles a year on increasingly large world tours, leading to higher sales of CDs, which in turn produce thousands of tonnes of waste in plastic packaging. They own private jets, fleets of cars, and heat and light huge mansions that are empty for half the year. They then go and pocket extra cash and exposure advertising cars and soft drinks. By taking part, the artists increase their public profile and gain exposure to new audiences, thereby landing bigger tours, selling more CDs and being able to buy more planes, cars and houses, all whilst encouraging me to give up my holidays and cycle to work. Rather than let these people lecture me about what I could do, I left my TV on standby and went for a drive.” If true, which of the following present effective challenges to the position taken by the writer? 

    1.Pop stars and celebrities have a broader appeal than politicians and environmentalists and are more likely to influence the public.

    2.By becoming more aware of themselves, the artists will start to do more to raise awareness of environmental issues.

    3.The artists weren’t paid to perform and therefore did not gain financially from the concert.

    17.
  • 0
    0

    Explanation

    The correct answer is A.

    The writer expresses that celebrities tend to be contradictory with what they say and what they do in order to decrease the damage done to the environment. It is not up to celebrities to tell the general public how to behave, if they themselves do not act differently. Thus, the writer concludes by saying that no change will be implemented on his/her behalf by saying; ‘rather than let these people lecture me about what I could do, I left my TV on standby and went for a drive.’ This implies that celebrities do not have an affect on the general public in ways in which they can change to improve the environment. However, statement A challenges the author’s perspective if celebrities tend to have a greater appeal than politicians and environmentalists do and are thus more likely to influence the public. This means that the public would be more likely to change their behaviours if a celebrity told them to compared to a politician or an environmentalist.

    Post Comment

    It is known that droplets of a certain chemical have a volume of 0.02 cm³ (rounded to the nearest 0.01 cm³).

    18. What is the maximum number of droplets of the chemical that can be mixed with 10 cm³ of water (rounded to the nearest 10 cm³) if the resulting solution must not have more than 1 % of the chemical in?
  • 0
    0

    Explanation

    The correct answer is A.

    To ensure the solution does not have more than 1% of the chemical in, we need to assume that each droplet has its maximum volume of 0.025cm^3, and the water has its minimum volume of 5cm^3. 1% of 5cm^3 is 5/100=0.05cm^2. This is the maximum volume of 0.05/0.025=2 drops of the chemical.

    Post Comment

    Even moderate exercise boosts longevity, study says

    Sorry, couch potatoes – the verdict is in: people who exercise regularly really do live longer.

    In fact, people who get a good workout almost daily can add nearly four years to their lives, according to the first study to quantify the impact of physical activity this way.

    The researchers looked at records of more than 5,000 middle aged and elderly Americans and found that those who had moderate to high levels of activity lived 1.4 to 3.6 years longer than those who got little exercise, largely because they put off developing heart disease – the nation’s leading killer. Men and women benefited about equally.

    Previous studies have found that being physically active has a host of health benefits. It reduces the risk of being overweight and of developing many illnesses and improves overall quality of life. But the new study is the first to directly calculate the effect on how long people live.

    Oscar Franco, of the Erasmus M.C. University Medical Center in Rotterdam, and his colleagues analysed the data from the Framingham Heart Study, a well-known research project that has followed 5,209 residents of one Massachusetts town for more than 40 years, collecting detailed information about their lifestyles and health.

    People who engaged in moderate activity – the equivalent of walking for 30 minutes a day – lived on average 1.4 years longer than those who were less active. Those who took on more intense exercise – the equivalent of running half an hour a day – extended their lives on average by 3.6 years, the researchers found.

    Franco and others noted that this and other studies show that people do not have to be exercise fanatics to reap the benefits. “What we’re talking about is small changes,” said James Hill of the University of Colorado in Denver. “We’re telling people to get out and walk more. Fifteen, 20 or 30 minutes of walking each day is probably enough.”

    19. If the average lifespan of an American male who does not exercise is 75, to how much might this average be expected to be increased by running for 30 minutes a day? (Answer to the nearest year.)
  • 0
    0

    Explanation

    The correct answer is B (79).

    ‘Those who took on more intense exercise – the equivalent of running half an hour a day – extended their lives on average by 3.6 years, the researchers found.’ Therefore the answer is 75+3.6=78.6=79 years to the nearest year.

    Post Comment

    Even moderate exercise boosts longevity, study says

    Sorry, couch potatoes – the verdict is in: people who exercise regularly really do live longer.

    In fact, people who get a good workout almost daily can add nearly four years to their lives, according to the first study to quantify the impact of physical activity this way.

    The researchers looked at records of more than 5,000 middle aged and elderly Americans and found that those who had moderate to high levels of activity lived 1.4 to 3.6 years longer than those who got little exercise, largely because they put off developing heart disease – the nation’s leading killer. Men and women benefited about equally.

    Previous studies have found that being physically active has a host of health benefits. It reduces the risk of being overweight and of developing many illnesses and improves overall quality of life. But the new study is the first to directly calculate the effect on how long people live.

    Oscar Franco, of the Erasmus M.C. University Medical Center in Rotterdam, and his colleagues analysed the data from the Framingham Heart Study, a well-known research project that has followed 5,209 residents of one Massachusetts town for more than 40 years, collecting detailed information about their lifestyles and health.

    People who engaged in moderate activity – the equivalent of walking for 30 minutes a day – lived on average 1.4 years longer than those who were less active. Those who took on more intense exercise – the equivalent of running half an hour a day – extended their lives on average by 3.6 years, the researchers found.

    Franco and others noted that this and other studies show that people do not have to be exercise fanatics to reap the benefits. “What we’re talking about is small changes,” said James Hill of the University of Colorado in Denver. “We’re telling people to get out and walk more. Fifteen, 20 or 30 minutes of walking each day is probably enough.”

    20. What, approximately, is the percentage increase in extra years of lifespan due to running for 30 minutes a day, rather than walking for the same time?
  • 0
    0

    Explanation

    The correct answer is C.

    See paragraph 6.

    (3.6-1.4)/1.4=1.57=157%

    Post Comment

    Even moderate exercise boosts longevity, study says

    Sorry, couch potatoes – the verdict is in: people who exercise regularly really do live longer.

    In fact, people who get a good workout almost daily can add nearly four years to their lives, according to the first study to quantify the impact of physical activity this way.

    The researchers looked at records of more than 5,000 middle aged and elderly Americans and found that those who had moderate to high levels of activity lived 1.4 to 3.6 years longer than those who got little exercise, largely because they put off developing heart disease – the nation’s leading killer. Men and women benefited about equally.

    Previous studies have found that being physically active has a host of health benefits. It reduces the risk of being overweight and of developing many illnesses and improves overall quality of life. But the new study is the first to directly calculate the effect on how long people live.

    Oscar Franco, of the Erasmus M.C. University Medical Center in Rotterdam, and his colleagues analysed the data from the Framingham Heart Study, a well-known research project that has followed 5,209 residents of one Massachusetts town for more than 40 years, collecting detailed information about their lifestyles and health.

    People who engaged in moderate activity – the equivalent of walking for 30 minutes a day – lived on average 1.4 years longer than those who were less active. Those who took on more intense exercise – the equivalent of running half an hour a day – extended their lives on average by 3.6 years, the researchers found.

    Franco and others noted that this and other studies show that people do not have to be exercise fanatics to reap the benefits. “What we’re talking about is small changes,” said James Hill of the University of Colorado in Denver. “We’re telling people to get out and walk more. Fifteen, 20 or 30 minutes of walking each day is probably enough.”

    “Franco’s findings show that even for people who are already middle-aged, exercising more can add years to their lives.”

    21. What is the relationship of this observation and the information given in the passage?
  • 0
    0

    Explanation

    The correct answer is C.

    This conclusion infers more than is supported by the evidence in the passage. We do not know whether these middle-aged people who exercised more than their less active counterparts have been doing so for their entire life or have begun doing so recently. So we cannot say from the data given that if a middle-aged person began exercising it would increase his/her life expectancy.

    Post Comment

    Even moderate exercise boosts longevity, study says

    Sorry, couch potatoes – the verdict is in: people who exercise regularly really do live longer.

    In fact, people who get a good workout almost daily can add nearly four years to their lives, according to the first study to quantify the impact of physical activity this way.

    The researchers looked at records of more than 5,000 middle aged and elderly Americans and found that those who had moderate to high levels of activity lived 1.4 to 3.6 years longer than those who got little exercise, largely because they put off developing heart disease – the nation’s leading killer. Men and women benefited about equally.

    Previous studies have found that being physically active has a host of health benefits. It reduces the risk of being overweight and of developing many illnesses and improves overall quality of life. But the new study is the first to directly calculate the effect on how long people live.

    Oscar Franco, of the Erasmus M.C. University Medical Center in Rotterdam, and his colleagues analysed the data from the Framingham Heart Study, a well-known research project that has followed 5,209 residents of one Massachusetts town for more than 40 years, collecting detailed information about their lifestyles and health.

    People who engaged in moderate activity – the equivalent of walking for 30 minutes a day – lived on average 1.4 years longer than those who were less active. Those who took on more intense exercise – the equivalent of running half an hour a day – extended their lives on average by 3.6 years, the researchers found.

    Franco and others noted that this and other studies show that people do not have to be exercise fanatics to reap the benefits. “What we’re talking about is small changes,” said James Hill of the University of Colorado in Denver. “We’re telling people to get out and walk more. Fifteen, 20 or 30 minutes of walking each day is probably enough.”

    22. Which of the following is an unstated assumption made in drawing the main conclusion?
  • 0
    0

    Explanation

    The correct answer is D.

    The main conclusion is stated explicitly in the first paragraph: ‘people who exercise regularly really do live longer’. The support given for this argument is data showing increased life-expectancy for those who exercise more. However, this is assuming that all other factors which could influence longevity are controlled and have no influence. Hence D is the assumption.

    Post Comment

    A code for transmitting binary signals at night is devised which assigns an ordered combination of red and blue flashes to each letter of the alphabet. In order to keep transmissions short, the shortest possible ‘strings’ of red and blue flashes are assigned first:

     One red flash for A

    One blue flash for B

    Two red flashes for C

    One red followed by one blue flash for D

     And so on, introducing longer strings as necessary.

    23. Given that flashes will be transmitted once a second and a one second gap will be left in between letters, how many seconds would it take to transmit the entire alphabet of 26 letters?
  • 0
    0

    Explanation

    The correct answer is D.

    Post Comment

    “Young British competitors today are too friendly, and this is affecting their chances of winning major championships. They are all too close, all the current generation are having lunch together and then going off to play for a million dollars.

    In the past competitors had to win over and over again to become well known and create a future and a pension plan. These guys now have a future in a year. You can be a millionaire now in six months without even winning. They’ve got their own clothing lines, they advertise drinks and sportswear, and even have management companies guaranteeing them a signing-on fee for playing in a tournament. In the past it was necessary to play well just to be invited to top events. They started out with little or nothing and were lucky to receive £100 as expenses in one week. But look at what they achieved!”

    24. Which of the following is a conclusion that can be drawn from the above passage?
  • 0
    0

    Explanation

    The correct answer is D.

    Statement D is correct to deduce from the statement ‘you can be a millionaire now in six months without even winning.’ This supports the statement that players make more money from appearances and commitments outside of winning sports competitions.

    Statement A is incorrect because there is no mention of playing standards being reduced in competitors due to commitments outside of sporting.

    Statement B is incorrect because there is no mention of how British players are more interested in money compared to players from other countries despite their earning potentials having increasing compared to past British player generations.

    Statement C is incorrect because there is no mention of previous players were unfriendly to their opponents despite British competitors being ‘too friendly’ now.

    Statement E is incorrect because there is no mention that increased commitments outside of sports makes it harder to win competitions, despite having increased commitments outsides of competitive sports from players compared to past competitors.

    Post Comment

    In a particular country there are two political parties, the Red Party and the Blue Party. Prior to last week’s General Election the Red Party had 2½ times as many representatives in the parliament as the Blue Party. The Red Party’s lead has been reduced by 56 as a result of the General Election, but it now has 1½ times as many representatives as the Blue Party.

    25. How many seats are there in the parliament?
  • 0
    0

    Explanation

    The correct answer is B.

    We can form a pair of simultaneous equations from the information given:

    R=2.5B and R-56=1.5B

    Where R=the number of representatives the Red party had prior to last week’s election, and B=the number of representatives the Blue party had prior to last week’s election. Solving by substituting the first equation into the second:

    (2.5B)-56=1.5B

    B=56

    R=2.5(56)=140.

    Post Comment

    Suggestions that there should be a national database storing DNA samples from all citizens should be resisted. At present the police take DNA samples from everyone who has been arrested, and they store the samples regardless of whether the suspect is subsequently convicted. This database has provided evidence for the arrest and conviction of rapists and murderers. However, the database should contain the DNA only of those convicted of a sexual or violent crime. To store the DNA of innocent people is an infringement of the right to privacy of those who have never committed a crime. Moreover it is unnecessary, since the police need access to the DNA only of those convicted of a serious offence in order to solve cases of sexual and violent crime.

    1.Some cases of sexual and violent crime are first offences.

    2.Some people who are found not guilty of a crime may have committed it.

    3.Some cases of sexual and violent crime are solved without DNA evidence.

    26. Which of the following identify/ identifies a weakness in the above argument?
  • 0
    0

    Explanation

    The correct answer is D.

    The passage concludes that ‘the database should contain the DNA only of those convicted of a sexual or violent crime,’ and that holding DNA of innocent people would compromise their primacy and those who have never committed a crime before.

    Statement 1, if considered true, weakens the argument as first offenders would not have their DNA in the database despite having committed their first crime.

    Statement 2 is also correct because those people who are found not guilty of a crime despite having committed it, should have their DNA collected as they have committed the crime.

    Statement 3 is incorrect as solving crimes without DNA evidence is not relevant to the main conclusion.

    Post Comment

    An army convoy is 1 km long. The General at the front wants to send a message to the rearmost vehicle, so he tells a motorcycle courier to go to the back, hand over the message and return. The courier hands over the message while the rearmost vehicle is moving, and returns immediately. It takes him half a minute to get to the back and 3 minutes to return to the front.

    27. If the convoy and courier travel at constant speeds, how fast does the courier travel?
  • 0
    1

    Explanation

    The correct answer is C.

    When the courier is travelling to the back, the time taken will be due to the sum of the speed of the courier and of the convoy. When the courier is returning to the front, the time it takes will be due to the difference in speed between the courier and convoy. Using the equation linking time(hrs)=distance(km)/speed(km/h), we can form a pair of simultaneous equations:

    1/(c+d)=1/120 and 1/(c-d)=1/20

    Where c=the speed of the courier and d= the speed of the convoy.

    Solving:

    c+d=120 and c-d=20

    d=c-20

    c+c-20=120

    2c=140

    c=70

    Therefore the speed of the courier is 70km/h.

    Post Comment

    Many areas of Britain have been subject to serious flooding in recent years. People who own homes in flooded areas already find it very difficult to sell their houses. With the pace of climate change set to increase, more areas will be at risk of flooding. We are, therefore, facing a future of limited geographic mobility which will have social and economic consequences.

    1.Climate change is the cause of flooding.

    2.No effective action will be taken to prevent homes being flooded.

    3.People will not want to move to areas at risk of flooding.

    28. Which of the following statements are assumptions underlying the above argument?
  • 0
    0

    Explanation

    The correct answer is E.

    With the statement in purple it is assuming that climate change is responsible for increasing the areas at risk of flooding.

    With the statement in red, it is assuming no action will be taken to prevent this flooding.

    With the statement in yellow, it is assuming that people will find it harder to sell their houses leading to economic consequences.

    Post Comment

    In the main draw of the National Lottery six different numbers between 1 and 49 inclusive are selected at random live on television. My sister and I both buy a ticket every week. Whenever one of us is not able to watch the draw the other texts the numbers the instant the sixth one is revealed.

    e.g. 15, 46, 20, 31, 5, 22

    One week however, my sister forgot to leave gaps between the numbers and I received the following:

    3437427337

    Luckily, upon closer scrutiny, I could see that there was only one arrangement possible.

    29. What was the highest of these six lottery numbers?
  • 0
    0

    Explanation

    The correct answer is C.

    The only possible arrangement is 34 37 4 27 33 7, as we: must have 6 numbers, cannot have any 2 digit numbers beginning with 7 (because the numbers are all below 50) and cannot have the same number (e.g. 7) more than once. The highest number is therefore 37.

    Post Comment

    The implementation this year of more random speed traps to prevent accidents is absurd. Figures published earlier this year showed that only 6 % of accidents are caused by speeding. But half the deaths on the roads are caused by drivers under 25. The road safety campaigners should turn their attention to finding ways of helping young people to drive safely while they are gaining experience, instead of advocating the pursuit of safe and responsible drivers for technical infringements of arbitrary limits.

    1.The writer ignores the fact that the introduction of more random speed traps, though not focusing on the most common cause of accidents, is still designed to prevent them.

    2.The writer ignores the fact that a percentage of deaths caused by drivers under the age of 25 will be due to speeding.

    3.The writer fails to appreciate the fact that safe and responsible driving includes obeying the speed limit.

    30. Which of the following could be flaws in the argument?
  • 0
    0

    Explanation

    The correct answer is E.

    P1: 6% accidents are caused by speeding

    P2: Half the deaths on the roads are caused by drivers >25.

    C1: Road safety campaigners should focus on helping young people to drive safely rather than the current action taken.

    Statement 1: This is a flaw because the argument focuses on just fixing the ‘main’ causes deaths.

    Statement 2: We cannot assume this and it is not written in the text.

    Statement 3: This is a flaw as there is a gap between P2 and C1. The passage assumes that the only way someone can be a ‘safe and responsible’ driver is by preventing themselves committing road deaths.

    Post Comment

    The picture below shows the pieces of a puzzle called the Soma Cube which may be assembled to make a 3 x 3 x 3 cube.

    31. Which other piece, along with pieces F and G, can be used to make a 3 x 2 x 2 cuboid?
  • 0
    0

    Explanation

    The correct answer is B.

    Post Comment

    Section 1: Cycling level – facts

    According to the 2005 National Travel Survey (NTS) cycling is a relatively rare means of travel in the UK, and is declining.

    • Cycling accounts for 1% of all trips*, and 2% of trips of less than 2 miles, including those that are made on foot.
    • The average person makes 14 cycle trips per year and cycles a distance of 36 miles.
    • When asked how often they ride a bike, 15% of the population say at least once a week, and a further 8% say at least once a month. Over two thirds (69%) of people say they cycle less than once a year or never.
    • Those who do cycle average 5 trips a week by bicycle and travel 13 miles in a week. Cycling accounts for a fifth (22%) of all trips by cyclists.

    *For the purposes of the survey a ‘trip’ is a one-way journey having a single main purpose – e.g. going to work.

    A ‘cyclist’ is someone who cycles once a week or more.

    Section 2: Charts

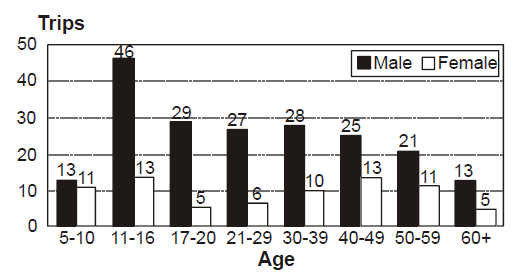
    Chart 1: Cycle trips per person per year, by sex and age:

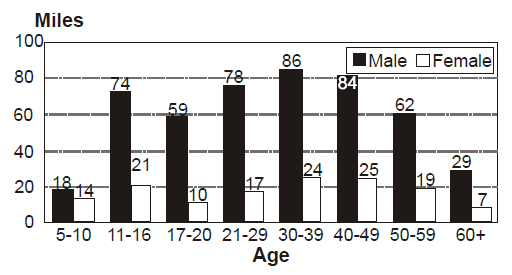
    Chart 2: Distance travelled by bicycle per person per year, by sex and age:

    Section 3: Cycling, income and car-ownership

    People living in households with lower levels of income make, on average, fewer bicycle trips and travel shorter distances by bicycle than those in higher income households. Those in the highest income quintile (top 20%) cycle 49 miles per person per year compared with 29 miles among people in the lowest income quintile. The poorest fifth, despite being the least likely to own a car, are also the least likely to cycle.

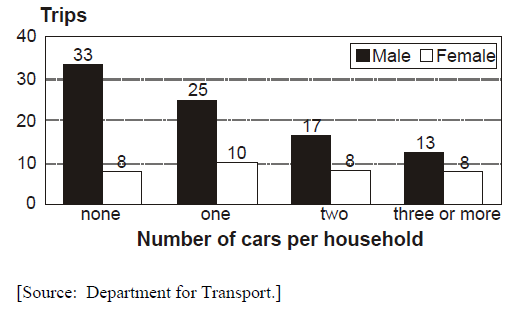
    Chart 3: Cycle trips, by car ownership

    32. Which of the following is the best estimate of the average number of trips by all modes of travel made per person per week?
  • 0
    0

    Explanation

    The correct answer is E.

    ‘Cycling accounts for 1% of all trips’.The average person makes 14 cycle trips per year’. This means on average 14/0.01=1400 trips by all modes of travel are made on average per person per year. So weekly, this would mean on average 1400/52=26.9=27 trips.

    Post Comment

    Section 1: Cycling level – facts

    According to the 2005 National Travel Survey (NTS) cycling is a relatively rare means of travel in the UK, and is declining.

    • Cycling accounts for 1% of all trips*, and 2% of trips of less than 2 miles, including those that are made on foot.
    • The average person makes 14 cycle trips per year and cycles a distance of 36 miles.
    • When asked how often they ride a bike, 15% of the population say at least once a week, and a further 8% say at least once a month. Over two thirds (69%) of people say they cycle less than once a year or never.
    • Those who do cycle average 5 trips a week by bicycle and travel 13 miles in a week. Cycling accounts for a fifth (22%) of all trips by cyclists.

    *For the purposes of the survey a ‘trip’ is a one-way journey having a single main purpose – e.g. going to work.

    A ‘cyclist’ is someone who cycles once a week or more.

    Section 2: Charts

    Chart 1: Cycle trips per person per year, by sex and age:

    Chart 2: Distance travelled by bicycle per person per year, by sex and age:

    Section 3: Cycling, income and car-ownership

    People living in households with lower levels of income make, on average, fewer bicycle trips and travel shorter distances by bicycle than those in higher income households. Those in the highest income quintile (top 20%) cycle 49 miles per person per year compared with 29 miles among people in the lowest income quintile. The poorest fifth, despite being the least likely to own a car, are also the least likely to cycle.

    Chart 3: Cycle trips, by car ownership

    33. Which one of the following can safely be inferred from Section 1 of the fact sheet?
  • 0
    0

    Explanation

    The correct answer is D.

    ‘15% of the population say at least once a week’ when asked how often they cycle. This may suggest that 85% of the population cycle less than once a week, but the keyword here is ‘say’ : we do not know whether what people are saying is true/accurate or if the sample who were asked are representative of the population as a whole.

    Therefore A cannot be inferred.

    The average person makes 14 cycle trips per year and cycles a distance of 36 miles. ‘ This equates to 14/12=1.2 cycle trips per month, so B is not correct.

    Apart from cycling, no other methods of transport are specified so we do not know how many miles are walked relative to the number of miles cycled. So C cannot be inferred either.

     ‘When asked how often they ride a bike, 15% of the population say at least once a week, and a further 8% say at least once a month. Over two thirds (69%) of people say they cycle less than once a year or never. ‘ This leaves the group who cycle between once a year and less than once a month (11 times a year), which must be the remaining percentage: 100-15-8-69=100-92=8%.

    Post Comment

    Section 1: Cycling level – facts

    According to the 2005 National Travel Survey (NTS) cycling is a relatively rare means of travel in the UK, and is declining.

    • Cycling accounts for 1% of all trips*, and 2% of trips of less than 2 miles, including those that are made on foot.
    • The average person makes 14 cycle trips per year and cycles a distance of 36 miles.
    • When asked how often they ride a bike, 15% of the population say at least once a week, and a further 8% say at least once a month. Over two thirds (69%) of people say they cycle less than once a year or never.
    • Those who do cycle average 5 trips a week by bicycle and travel 13 miles in a week. Cycling accounts for a fifth (22%) of all trips by cyclists.

    *For the purposes of the survey a ‘trip’ is a one-way journey having a single main purpose – e.g. going to work.

    A ‘cyclist’ is someone who cycles once a week or more.

    Section 2: Charts

    Chart 1: Cycle trips per person per year, by sex and age:

    Chart 2: Distance travelled by bicycle per person per year, by sex and age:

    Section 3: Cycling, income and car-ownership

    People living in households with lower levels of income make, on average, fewer bicycle trips and travel shorter distances by bicycle than those in higher income households. Those in the highest income quintile (top 20%) cycle 49 miles per person per year compared with 29 miles among people in the lowest income quintile. The poorest fifth, despite being the least likely to own a car, are also the least likely to cycle.

    Chart 3: Cycle trips, by car ownership

    Referring to Section 3 “Those in the highest income quintile (top 20 %) cycle 49 miles per person per year compared with 29 miles among people in the lowest quintile.”

    The relationship shown in Chart 3 between car ownership and cycling seems to contradict the data on cycling and income.

    34. Which of the following, if true, would adequately explain this seeming contradiction?
  • 0
    0

    Explanation

    The correct answer is C.

    Post Comment

    Section 1: Cycling level – facts

    According to the 2005 National Travel Survey (NTS) cycling is a relatively rare means of travel in the UK, and is declining.

    • Cycling accounts for 1% of all trips*, and 2% of trips of less than 2 miles, including those that are made on foot.
    • The average person makes 14 cycle trips per year and cycles a distance of 36 miles.
    • When asked how often they ride a bike, 15% of the population say at least once a week, and a further 8% say at least once a month. Over two thirds (69%) of people say they cycle less than once a year or never.
    • Those who do cycle average 5 trips a week by bicycle and travel 13 miles in a week. Cycling accounts for a fifth (22%) of all trips by cyclists.

    *For the purposes of the survey a ‘trip’ is a one-way journey having a single main purpose – e.g. going to work.

    A ‘cyclist’ is someone who cycles once a week or more.

    Section 2: Charts

    Chart 1: Cycle trips per person per year, by sex and age:

    Chart 2: Distance travelled by bicycle per person per year, by sex and age:

    Section 3: Cycling, income and car-ownership

    People living in households with lower levels of income make, on average, fewer bicycle trips and travel shorter distances by bicycle than those in higher income households. Those in the highest income quintile (top 20%) cycle 49 miles per person per year compared with 29 miles among people in the lowest income quintile. The poorest fifth, despite being the least likely to own a car, are also the least likely to cycle.

    Chart 3: Cycle trips, by car ownership

    1.Males between 21 and 29 cycle more than twice as far per trip as males between 11 and 16

    2.Males between 11 and 16 cycle more often than males between 17 and 20 but average fewer miles per trip

    35. Which of the following statements is supported by the data in charts 1 and 2?
  • 0
    0

    Explanation

    The correct answer is B.

    Males 21-29 cycle on average 27 times per person per year and travel 78 miles per year. Males 11-16 cycle on average 46 times per person per year and travel 74 miles per year. So on average per trip males 21-29 cycle 78/27=2.9 miles and males 11-16 cycle 74/46=1.6 miles. 2.9 is less than double 1.6, therefore statement 1 is incorrect.

    However statement 2 is correct as males 11-16 make more cycle trips per person per year than males 17-20, and calculations show that males 17-20 cycle on average 59/29=2.0miles per trip, compared to 1.6miles for males 11-16.

    Post Comment

    BMAT 2008 S1 Review Screen

    Instructions

    Below is a summary of your answers. You can review your questions in three (3) different ways.

    The buttons in the lower right-hand corner correspond to these choices:

    1. Review all of your questions and answers.
    2. Review questions that are incomplete.
    3. Review questions that are flagged for review. (Click the 'flag' icon to change the flag for review status.)

    You may also click on a question number to link directly to its location in the exam.

    BMAT 2008 S1 Section

    Final Answer Review Screen

    Instructions

    This review section allows you to view the answers you made and see whether they were correct or not. Each question accessed from this screen has an 'Explain Answer' button in the top left hand side. By clicking on this you will obtain an explanation as to the correct answer.

    At the bottom of this screen you can choose to 'Review All' answers, 'Review Incorrect' answers or 'Review Flagged' answers. Alternatively you can go to specific questions by opening up any of the sub-tests below.

    BMAT 2008 S1 Section

    x

    +/-
    %
    MRC
    M-
    M+
    7
    8
    9
    4
    5
    6
    1
    2
    3
    ON/C
    0
    .
    ÷
    ×
    -
    +
    =

    Let's get acquainted ?
    What is your name?

    Next

    Nice to meet you, {{name}}!
    What is your preferred phone number?

    What is your preferred phone number?

    Next

    Just to check, what are you interested in?

    1-1 Tutoring Online Course Bursaries/Resources Other

    When should we call you?

    Another Day
    Skip the Call

    What time works best for you? (UK Time)

    8am-2pm 2pm-10pm
    10:00-10:30 10:30-11:00 11:00-11:30 11:30-12:00 12:00-12:30 12:30-13:00
    15:00-15:30 15:30-16:00 16:00-16:30 16:30-17:00 17:00-17:30 17:30-18:00 18:00-18:30 18:30-19:00 19:00-19:30 19:30-20:00

    How many hours of 1-1 tutoring are you looking for?

    0-5 10 20-30 40+

    My WhatsApp number is...

    Same as the one I entered Different to the one I entered

    For our safeguarding policy, please confirm...

    For our safeguarding policy, please confirm...

    I am under 18 I am over 18

    Which online course are you interested in?

    Next

    What is your query?

    Submit

    Sure, what is your query?

    Submit

    Loading...

    Thank you for your response.
    We will aim to get back to you within 12-24 hours.

    Lock in a 2 Hour 1-1 Tutoring Lesson Now

    If you're ready and keen to get started click the button below to book your first 2 hour 1-1 tutoring lesson with us. Connect with a tutor from a university of your choice in minutes. (Use FAST5 to get 5% Off!)

    Buy Now for £70