Your Time has Finished
Which UCAT Exam
are you sitting?
Loading...

QR Graph Questions
Your Score:
Average Score of All Users:
You performed better than of students
Section Breakdown
| Your Score | Average of all Users | Percentile | |
|---|---|---|---|
| Graph |
Graph
Your score:
Average score:
You performed better than of students
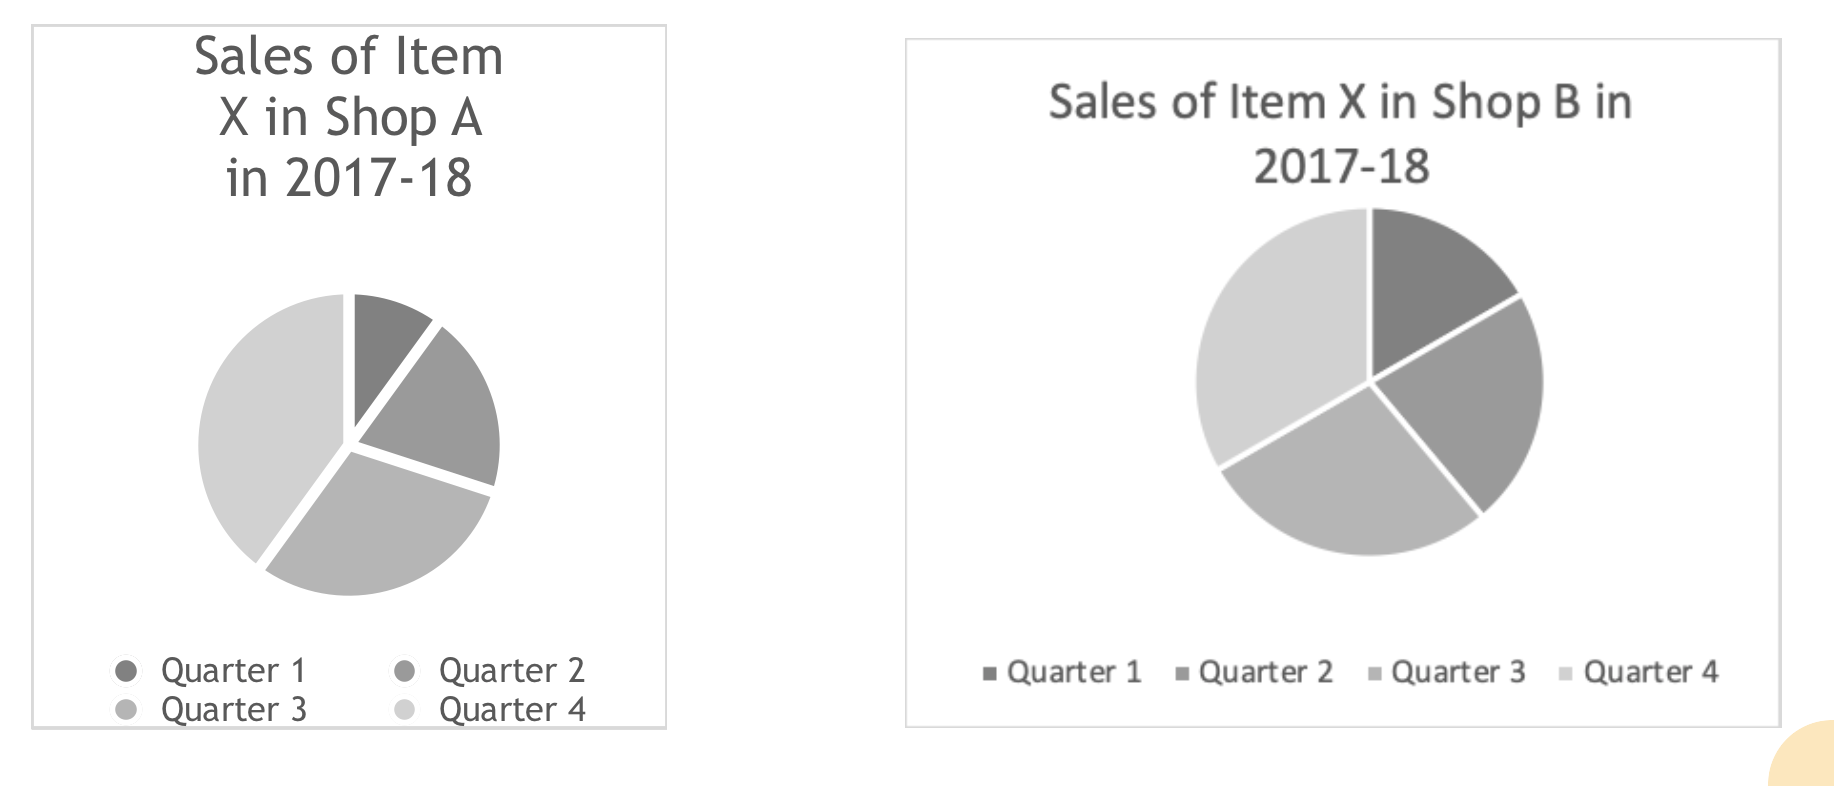
Item X is the best-selling new sous vide circulator that every wannabe home-chef wishes to own. It has seven speeds and can be controlled from a mobile app. The product has received rave reviews – appearing in the QG magazine of ‘Top Ten Kitchen Items Any Gentleman Should Own’.
Sales of Item X in Shop A in 2018-19
|
Quarter |
Sales |
|
Q1 |
75 |
|
Q2 |
100 |
| Q3 |
250 |
| Q4 |
175 |
Explanation
Answer: E
Explanation: Without information on the total number of sales, we cannot compare the pie charts. Thus, the claim that the sales were higher in Shop A than Shop B cannot be supported as we only know that the sales were a higher proportion of the whole year in Q1 in Shop A rather than being a higher number sold.
Top Tip: Remember that pie charts cannot be compared if we do not know the total number of items sold. 33% of 2 is smaller than 20% of 2000.
Item X is the best-selling new sous vide circulator that every wannabe home-chef wishes to own. It has seven speeds and can be controlled from a mobile app. The product has received rave reviews – appearing in the QG magazine of ‘Top Ten Kitchen Items Any Gentleman Should Own’.
Sales of Item X in Shop A in 2018-19
|
Quarter |
Sales |
|
Q1 |
75 |
|
Q2 |
100 |
|
Q3 |
250 |
|
Q4 |
175 |
Explanation
Answer: E
Explanation:
1. Find the total sales in each quarter for B and compare
We are looking for 2018-19 so it is based on the information in the table:
For percentage difference:
New Value = Original Value x Multiplier
Top tip: For information on how to find a multiplier for a given percentage difference, look at the Medic Mind Lesson on the topic.
For Quarter 1: 33% higher so
New = 75 x 1.33
New = 100
Repeat these calculations for the figures for Q2 to Q4
Q2: 30% decrease – 100 x 0.7 = 70
Q3: 32% increase – 250 x 1.32 = 330
Q4: 44% decrease – 175 x 0.56 = 98
This gives a total of 100 + 70 + 330 + 98 = 598
For Shop A the total is:
75 + 100 + 250 + 175 = 600 – 2 more than in Shop B – answer option A.
Timing Tip: This question has differences in sales of one unit so it is important that you work precisely from the outset.
Item X is the best-selling new sous vide circulator that every wannabe home-chef wishes to own. It has seven speeds and can be controlled from a mobile app. The product has received rave reviews – appearing in the QG magazine of ‘Top Ten Kitchen Items Any Gentleman Should Own’.
Sales of Item X in Shop A in 2018-19
|
Quarter |
Sales |
|
Q1 |
75 |
|
Q2 |
100 |
| Q3 |
250 |
| Q4 |
175 |
Explanation
Answer: A
Explanation:
1. Identify the trend in size.
As it goes Q1 to Q4 in a clockwise direction, It has to go smallest, second smallest, biggest then smaller but not as small as the first 2.
From this fact alone, we know it must be one of A or C.
2. Find the total sales in each quarter for B and compare
The total sales are 600. The largest section of this is 250/600. This is less than half the total.
This means that C cannot be correct as it has a segment which is half of the total of the pie.
Therefore, A is the only possible correct answer.
Top Tip: Selecting Pie Charts may need some calculation – this required you to notice that there are 600 total sales and so the largest segment couldn’t be half the pie.
Common Trap: It might be tempting to go for Option D – it has the right size of segments but fails to take into account the fact that the question states that the pies go from Q1 to Q4 in a clockwise direction.
Item X is the best-selling new sous vide circulator that every wannabe home-chef wishes to own. It has seven speeds and can be controlled from a mobile app. The product has received rave reviews – appearing in the QG magazine of ‘Top Ten Kitchen Items Any Gentleman Should Own’.
Sales of Item X in Shop A in 2018-19
|
Quarter |
Sales |
|
Q1 |
75 |
|
Q2 |
100 |
|
Q3 |
250 |
|
Q4 |
175 |
Explanation
Answer: D
Explanation:
1. Find the number they have of each in stock and set up the ratio
They sell 50% of their blue Item Qs:
250 x 0.5 = 125 left
They then order 100 so:
125 + 100 = 225
They sell 75 of their red Item Qs but order 75 so there is no net change.
They therefore have 200 red Item Qs
This gives the ratio
225:200
2. Simplify the ratio
To simplify a ratio, divide by the highest common factor for the two sides. This is the largest number which both can be divided by.
For 225 and 200, this is 25.
225 / 25 = 9
200 / 25 = 8
This makes the simplified ratio 9:8.
Common Trap: Make sure to keep a track of the sales and restocking of the items. Answers A and B are variants to the ratio for the initial number of each and Answer E is the situation before restocking. Use the whiteboard to keep a track of the changes in stock levels – all the calculations are possible to do on it.
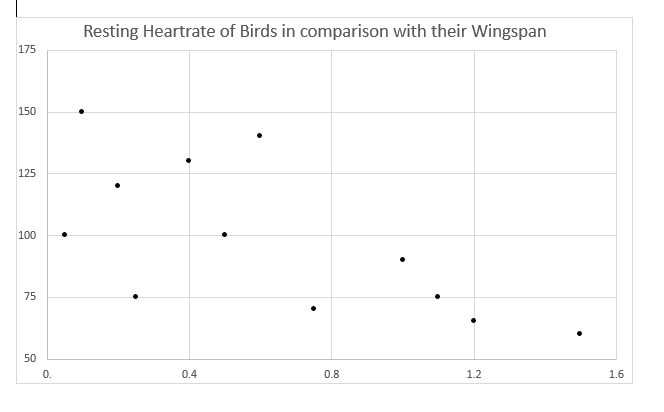
A university has researched all the 12 species of birds which are endemic to an island group in the Pacific Ocean. The project required the monitoring of the birds resting heart rate measured using trackers over a period of 72 hours. This chart shows the comparison of a resting heart rate of birds in comparison to their wingspan in metres.
Explanation
Answer: C
Explanation:
1. Find the number of birds in the chart and thus the ‘middle’ number.
To find the median add one to the number of birds and divide by 2 to find the middle number.
There are 12 birds so the median wingspan is: 12 + 1 = 13 / 2 = 6.5
The median is therefore halfway between the 6th and 7th number.
The sixth is at 0.50m and the seventh is at 0.60m. 0.55 Is halfway between these.
Top Tip: Remember that when there are an even number of values in a data set, the median is the average of the two ‘middle’ numbers.
 anon
Medicmind Tutor
anon
Medicmind Tutor
Mon, 19 Jul 2021 08:57:50
no units
anon
Medicmind Tutor
Thu, 29 Jul 2021 14:21:07
isnt the 5th at 0.5 and the 6th at 0.6?
Alex
Medicmind Tutor
Sun, 15 Aug 2021 15:06:56
@anon you have to find the midpoint as the median is halfway between values if the total number is even, hence 0.55. hope this made sense dude :)
Bonita
Medicmind Tutor
Thu, 07 Jul 2022 10:10:43
Why do we have to add 1 to the 12?
S
Medicmind Tutor
Fri, 08 Jul 2022 21:19:31
where do you find the sixth and the seventh number?
A university has researched all the 12 species of birds which are endemic to an island group in the Pacific Ocean. The project required the monitoring of the birds resting heart rate measured using trackers over a period of 72 hours. This chart shows the comparison of a resting heart rate of birds in comparison to their wingspan in metres.
Explanation
Answer: C
Explanation:
1. Identify the number with a heart rate below the median and those which don’t but do have an above average wingspan
There are six birds below the median heart rate.
There is one more bird which doesn’t have a low heart rate but does have an above average wingspan.
This means there are 7 meeting the criteria out of 12 birds total so the fraction is 7/12ths – C.
Timing Tip: Use knowledge of median as a concept to answer by inspection. You do not need to find the exact value but rather to rank the answers in order visually.
Common Trap: Remember that the fact that the median is the average of the two middle numbers, half the values will be above it and half below – this will include the two numbers which are averaged to find the median value.
Masrur
Medicmind Tutor
Wed, 30 Jun 2021 22:36:51
I do not understand how the bird with the 6th lowest heart rate is above the median heart rate.
4
Medicmind Tutor
Sun, 01 Aug 2021 13:01:19
what is the average wingspan
Alex
Medicmind Tutor
Sun, 15 Aug 2021 15:08:29
@4 the wingspan is 0.55 (answer to previous question). So you go below the midpoint of the fifth and sixth value
liz
Medicmind Tutor
Sat, 23 Oct 2021 15:10:20
why do we include the median when it's asking the above average wingspan
Anon
Medicmind Tutor
Mon, 13 Dec 2021 20:15:59
Hi, could someone explain to me whether we need to find the median heart rate? Or can we just answer this with the median wingspan of 0.55? I don't understand how we determine individuals who have a heart rate below the median. Thank you
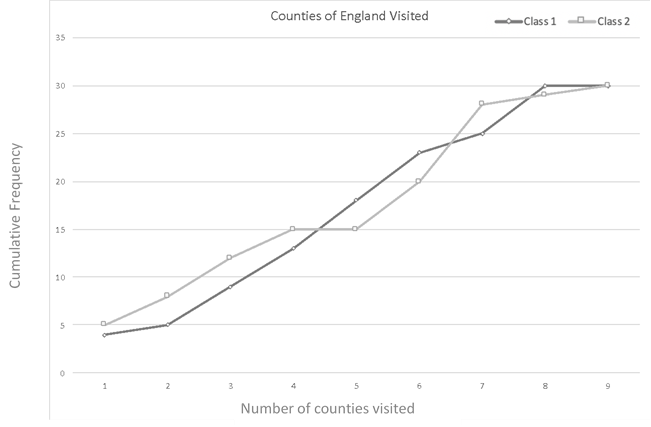
- Here is the graph about the number of English counties pupils in two classes at a primary school had visited.
- The class size for each was 30.
Explanation
Answer: B
Explanation:
1. Find where the cumulative frequency reaches the total class size:
There are 30 in the class so this happens at 8 counties for class 1 – B
Common Trap:Remember that this is a cumulative frequency graph not a line chart. This means that you are looking for the number of the x axis when you reach 30 on the y axis.
John Paul
Medicmind Tutor
Fri, 14 Aug 2020 12:31:57
why not 9 counties?
...
Medicmind Tutor
Sat, 10 Jul 2021 10:19:11
@John Paul because the line on the graph reach 8 first and then no longer increased
jn
Medicmind Tutor
Thu, 29 Jul 2021 17:01:05
The cumulative frequency remained at 30 when the counties went from 8 to 9. This means that there was no one who had visited 9 counties in class 1, which is why the cumulative frequency did not change.
- Here is information about the number of English counties pupils in two classes at a primary school had visited.
- The class size for each was 30.
Explanation
Answer: B
Explanation:
1. Find the number who have been to four counties as a proportion of the total.
Remember that a proportion considers one value as a percentage of the total value.
Exactly four counties is the increase from the value for 3 or fewer (12) to the value for 4 or fewer (15).
15 – 12 = 3
There are 30 in the class so:
3/30 = 10%
Common Trap: Remember that it is not a case of simply reading off the graph – the value at four is 15 which means that 15 have been to 4 or fewer counties rather than exactly four.
ehab
Mon, 12 Jul 2021 15:31:32
this doesnt make any sense, approximately 13 students went to 4 counties so that 13/30=43%
MM Tutor
Medicmind Tutor
Hi ehab, thanks so much for your comment! This is actually an example of a common trap - since we've been asked for the number of students who when to *exactly* 4 countries, we need to subtract the students who had been to 3 countries to find this value. Hope that helps!
S
Medicmind Tutor
Sat, 09 Jul 2022 15:07:32
Where does the 12 and 15 come from?
Blah Blah
Medicmind Tutor
Wed, 20 Jul 2022 14:17:37
The people that viewed exactly 3 countries are 12 and you can get that from the graph if you take a look at the position of the grey line above the value 3. That's how the number 15 was also discovered. Then you subtract the two values, divide by 30 and times by 100. Hope my explanation kinda makes sense.
- Here is information about the number of English counties pupils in two classes at a primary school had visited.
- The class size for each was 30.
Explanation
Answer: E
Explanation:
1. Find the greatest increase.
The increase in cumulative frequency highlights the number who have been to a specific number.
This happens for Class 2 between 6 and 7 so the largest number had been to 7 counties
Timing Tip: This question can be answered by inspection – the largest increase will be shown by the steepest gradient and this is clearly between six and seven.
- Here is information about the number of English counties pupils in two classes at a primary school had visited.
- The class size for each was 30.
Explanation
Answer: A
Explanation:
1. Find the number of students who have been to four or more counties
The easiest way is to find the number who have been to 3 or fewer and take it away from 60 (the size of the classes combined):
Originally this would be: 60 – 12 – 8 = 40.
Now add in the people who have now been to four or more following the summer:
60% of 5 = 3
50% of 4 = 2
40 + 3 + 2 = 45
2. Find this as a proportion of the total
Proportions consider one value in a set as a percentage of the total.
Here the value is the number who have been to four counties or more and the total is all the students in the two classes:
45/60 = 75%
Common Trap: Remember to consider the new students who have been to four or more, without these, the fraction would be two-thirds and thus the proportion 66.6%. This is a really difficult question so don’t be disheartened if you’re struggling with time! Keep practising and trust yourself!
lee
Medicmind Tutor
Tue, 06 Jul 2021 03:08:52
this is so hard LOL
Yusuf
Medicmind Tutor
Mon, 19 Jul 2021 20:29:55
This one is definitely a flag and guess for me!
alex
Medicmind Tutor
Wed, 11 Aug 2021 11:40:35
its like I get it I just haven't got the time to think that logically about it!
Lumi
Medicmind Tutor
Sat, 25 Sep 2021 05:07:00
I don't understand????
Tobi
Medicmind Tutor
Tue, 16 Aug 2022 10:39:47
I don't get why you are only -12 & 8. To get the students under 4 countries shouldn't you be subtracting all of the students under 4 countries from 60. I did 4+5+8 for class 1 and 5+7+12 for class 2 to get all the students under 4 countries and when I minuses that from 60 I got 19 and in the end I was left with 40%. Can someone explain the maths better because this explanation doesn't make sense to me.
HL
Medicmind Tutor
Sun, 21 Aug 2022 13:10:04
Understood the question but didn't have the time to do accurate calculations......
mia
Medicmind Tutor
Fri, 26 Aug 2022 12:17:07
@tobi . the values on the left are cumulative frequency values, meaning theyre all the totals for the students who have visited 4 countries and below. an easy way to look at it is to see that the value for both classes with 9 countries is 30 while there are only 30 people in each class (as per the statement). therefore the number of students under each value is the difference in the cumulative frequency. hopefully this helps explain why the values at 3 are subtracted :)
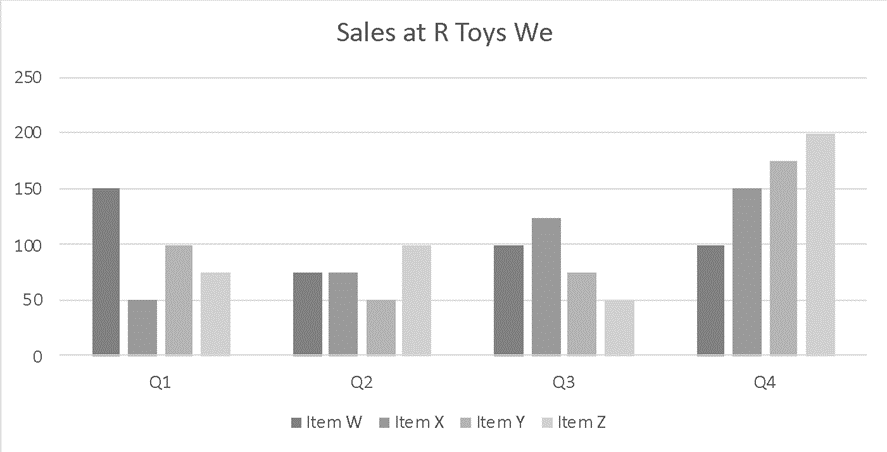
The following graph shows the sales data from R Toys We, showing the units sold for the four most popular items in a single store in a year.
Item W is an electric plane.
Item X is a toy car racing set.
Item Y is a toy phone
Item Z is an electronic cash register toy.
Item W had the lowest returns rate at 0.5% whilst Item Z was returned at double this rate.
Q1 is January to March, Q2 is April to June, Q3 is July to September and Q4 is October to December.
Explanation
Answer: D
Explanation:
1. Identify that this can be answered by inspection.
The question has asked for the average for the first six months of the year – quarters one and two.
There are three at 75, two at 50, two at 100 and one at 150. This means that the average of the first 7 is 75 and then one more at 150.
This means that the average must be above 75 but won’t be as high as 100 so option D or E. As 150 is much higher, the new average will be more than 0.4 above 75 so the answer must be D not E.
Timing Tip: As this question has asked for an average of 8 values, you may find it possible to add the numbers together and divide by 8. However, for questions with more values (such as for the four items for the whole year) estimation by eyeballing graphs will save time.
jwnv
Medicmind Tutor
Fri, 27 Aug 2021 17:27:15
why divide the sum of the numbers by 8 if the question asks for the average of the 4 items?
k
Medicmind Tutor
Wed, 15 Sep 2021 11:33:17
hi @jwnv, this is because although there are 4 items, there are 8 values being summed because you're adding values of both Q1 and Q2. In this case, you'll have to divide by 8.
R
Medicmind Tutor
Sat, 09 Jul 2022 15:28:37
Top tip - if you see a number way bigger than the others and you have to carry out an average just use that number and divide by number of all items. Often the really big number is the sum of all the items combined!
The following graph shows the sales data from R Toys We, showing the units sold for the four most popular items in a single store in a year.
Item W is an electric plane.
Item X is a toy car racing set.
Item Y is a toy phone
Item Z is an electronic cash register toy.
Item W had the lowest returns rate at 0.5% whilst Item Z was returned at double this rate.
Q1 is January to March, Q2 is April to June, Q3 is July to September and Q4 is October to December.
Explanation
Answer: D
Explanation:
1. This again can be answered by inspection.
We are looking for the second highest difference in height.
Item Z is the highest change – the second bar is around 2.5 times the height of the first.
Item X is the second largest change – it has doubled in height and so must be the second largest percentage change – this is the answer we are looking for so D is the answer.
Common trap: Note that it is asking for the second highest figure – this means that the answer is Item Z not Item X.
Sophie
Medicmind Tutor
Wed, 16 Feb 2022 14:39:21
does item X not go from 50 to 150, therefore tripling in height and making that the largest change?
Ella
Medicmind Tutor
Tue, 12 Jul 2022 03:33:55
X triples, so the 2nd highest would be z though
Tash
Medicmind Tutor
Thu, 14 Jul 2022 01:10:56
If X is the second largest then isn't that B not D?
Tash
Medicmind Tutor
Thu, 14 Jul 2022 01:12:35
oh height not %
A
Medicmind Tutor
Sun, 31 Jul 2022 11:27:26
The answer here is wrong. its Item Z
Junayd
Medicmind Tutor
Wed, 03 Aug 2022 12:01:28
Surely it is why when we consider that the highest change was Z with 50 in Q3 and 200 in Q4 however the next biggest increase is Y in Q2 going from 50 to 175
The following graph shows the sales data from R Toys We, showing the units sold for the four most popular items in a single store in a year.
Item W is an electric plane.
Item X is a toy car racing set.
Item Y is a toy phone
Item Z is an electronic cash register toy.
Item W had the lowest returns rate at 0.5% whilst Item Z was returned at double this rate.
Q1 is January to March, Q2 is April to June, Q3 is July to September and Q4 is October to December.
Explanation
Answer: D
Explanation:
1. Find the new sales of each.
New value = Multiplier x Old value.
For Item W: New sales = 0.8 x 100 = 80
For Item X: New sales = 1.1 x 150 = 165
1. Find the change in difference:
For the old values: 150 – 100 = 50
For the new values: 165 – 80 = 85
85 – 50 = 35 – option C.
Common trap:The question has asked for the change in difference not the new difference – this means the answer is 35 not 85
Lumi
Medicmind Tutor
Sat, 25 Sep 2021 05:17:20
How that multiplier number came?
ANON1
Medicmind Tutor
Mon, 13 Dec 2021 23:23:28
@Lumi Hi, assuming you mean the multiplier 1.1 for item X, recall that the questions states that item X had a increase of 10% = 100% + 10% = 1.10% = 1.1 Hope that helps
ST
Medicmind Tutor
Sat, 15 Apr 2023 16:24:52
20% = 0.2 0.2 x 100 = 20 10% = 0.1 0.1 x 150 = 15 20 + 15 = 35
ST
Medicmind Tutor
Sat, 15 Apr 2023 16:25:33
20% = 0.2 0.2 x 100 = 20 10% = 0.1 0.1 x 150 = 15 20 + 15 = 35
The following graph shows the sales data from R Toys We, showing the units sold for the four most popular items in a single store in a year.
Item W is an electric plane.
Item X is a toy car racing set.
Item Y is a toy phone
Item Z is an electronic cash register toy.
Item W had the lowest returns rate at 0.5% whilst Item Z was returned at double this rate.
Q1 is January to March, Q2 is April to June, Q3 is July to September and Q4 is October to December.
Explanation
Answer: D
Explanation:
1. Find the revenue for December as a percentage of the Q4 revenue.
Proportions compare one variable in comparison to the total.
Half of the sales came in December, but they were at a decreased price.
0.5 x £200 = £100
These were sold at £140:
100 x 140 = £14,000.
This price was a 20% reduction. To find the original price use the formula

The multiplier for a 20% reduction is 0.8
Therefore, the calculation is:
![]()
The sales were the same so:
£175 x 100 = £17,500
To find the proportion of revenue earned in December use the equation:
![]()
The December revenue was £14000, and the total is £14000 + £17500:
![]()
This means the answer is D.
Common trap: Note that the fact that half the sales occurred in December does not mean that half the revenue was from that month. The price was lower, so the amount of revenue generated for the same number of units sold was also lower.
CP
Medicmind Tutor
Fri, 07 Jan 2022 20:10:21
This is wrong the answer is D) 40%
CP
Medicmind Tutor
Fri, 07 Jan 2022 20:10:33
*E)
CP
Medicmind Tutor
Fri, 07 Jan 2022 20:11:23
oh no its not, nevermind
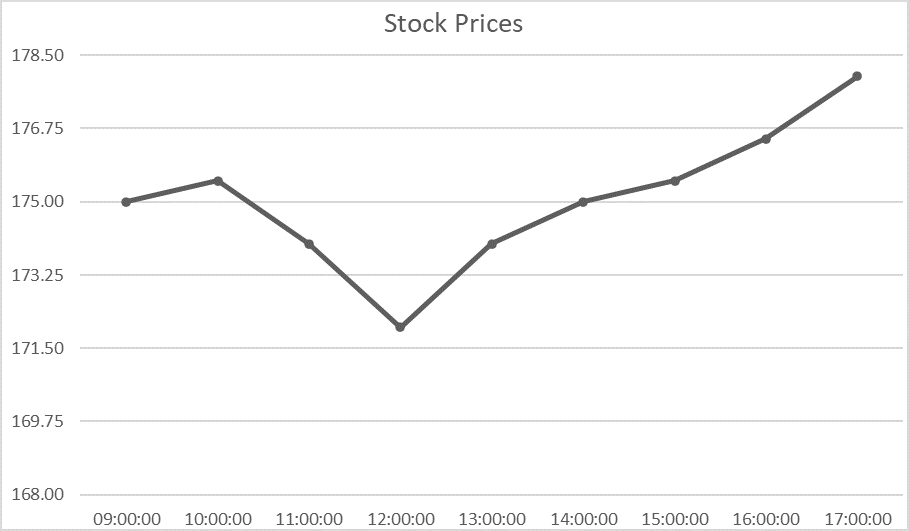
The stock price for a listed company is given over a single day.
The price is given in pence per share.
To buy shares a broker will pay an ‘offer’ price of 2p more per share than the price shown, with an additional price of £5 for stock purchases of 5000 or fewer shares. Above this level, there is a charge of 0.5%.
To sell shares a broker will be paid a ‘bid’ price 2p less than the price shown
There is a 2.5% deduction on any profit gained by buying and selling shares.
A company’s value is considered to be the price at which all the shares could be sold.
There are a total 500,000 shares in the company.
A dividend is an amount of money paid to shareholders quarterly according to how many stocks they hold.
Explanation
Answer: B
Explanation:
1. Find when the largest change in price occurs:
This comes between 10:00 and 11:00.
The change is 176p to 174p – 2p.
2. Work out what impact this makes on the company’s value.
There are 500,000 shares in the company so:
0.02 x 500,000 = £10,000 – C.
Common trap:It has asked for the largest hourly fluctuation rather than the largest fluctuation across the day or the increase across the day.
Timing Tip: The price of a company is found using the bid price. However, this doesn’t affect the change in price so you can read the change shown on the graph with no further calculation.
aiko
Medicmind Tutor
Sun, 18 Jul 2021 23:44:10
why is it multiplied by 0.02
Natalia
Medicmind Tutor
Wed, 21 Jul 2021 14:04:27
When I did the question, there was no graph and so I couldn't do the questions and had to guess all of them. However, the graph appeared when I finished the test and reviewed the questions
jn
Medicmind Tutor
Thu, 29 Jul 2021 17:17:37
Doesn't the biggest fluctuation occur between 11am and 12am? The change is still 2p, but I think the explanation has a mistake in the time.
Trish
Medicmind Tutor
Sat, 14 Aug 2021 16:21:32
I am confused on why the largest fluctuation is between 10-11am, is it not 11-12am.
Hafsah Atif
Medicmind Tutor
Sat, 11 Jun 2022 16:42:43
Why was the largest change in the space btwn 10 and 11 and not the steep fluctuation btwn 12 and 13
Fi
Medicmind Tutor
Sun, 07 Aug 2022 19:41:33
I don't understand how 176 and 174 are being pulled from that horrific graph
- The stock price for a listed company is given over a single day.
- The price is given in pence per share.
- To buy shares a broker will pay an ‘offer’ price of 2p more per share than the price shown, with an additional price of £5 for stock purchases of 5000 or fewer shares. Above this level, there is a charge of 0.5%.
- To sell shares a broker will be paid a ‘bid’ price 2p less than the price shown
- There is a 2.5% deduction on any profit gained by buying and selling shares.
- A company’s value is considered to be the price at which all the shares could be sold.
- There are a total 500,000 shares in the company.
- A dividend is an amount of money paid to shareholders quarterly according to how many stocks they hold.
Explanation
Answer: E
Explanation:
1. Find the ‘buy’ price of these shares and any additional cost.
The buy price at 13:00 is 174.00 + 2 = 176p
Find the total price for 150 shares
176 x 150 = 26,400p
In pounds this is £264.
There is an additional charge – for this £5 is greater than 1%
264 + 5 = £269
Common trap: Remember that the purchase price is 2p more per share. Always remember to read the bullet points below data as they can change the answer.
lmfao
Medicmind Tutor
Sun, 26 Sep 2021 06:39:33
I didn't see the graph so I chose 269 because 69 is always the answer
- The stock price for a listed company is given over a single day.
- The price is given in pence per share.
- To buy shares a broker will pay an ‘offer’ price of 2p more per share than the price shown, with an additional price of £5 for stock purchases of 5000 or fewer shares. Above this level, there is a charge of 0.5%.
- To sell shares a broker will be paid a ‘bid’ price 2p less than the price shown
- There is a 2.5% deduction on any profit gained by buying and selling shares.
- A company’s value is considered to be the price at which all the shares could be sold.
- There are a total 500,000 shares in the company.
- A dividend is an amount of money paid to shareholders quarterly according to how many stocks they hold.
Explanation
Answer: E
Explanation:
1. Find the price at which he bought the shares.
The buy price is the listed price of 172p + 2p = 174p
174p x 5000 = 870,000p
Convert this to pounds and add on the purchase price of £5.
870000/100 = £8700
£8700 + £5 = £8705
2. Find the price at which he sells the shares.
Five hours later, it is 1700. The price listed is 178p so he must have sold them at 176p.
176 x 5000 = 8800
3. Find the profit and therefore the amount he will receive.
8800 – 8705 = £95.
He is charged 2.5% therefore it is a decrease of 2.5%.
95 x 0.975 = £92.625
This rounds to £93.
Common trap: Remember that the price of purchase and the price of sale are not the same as the one listed.
Anonymous
Medicmind Tutor
Fri, 23 Jul 2021 19:19:05
Answer statistics show most people guess these questions. The UCAT test is a game of chance for many candidates.
T
Medicmind Tutor
Sun, 15 Aug 2021 16:27:42
What about "Above this level, there is a charge of 0.5%"
K
Medicmind Tutor
Wed, 15 Sep 2021 12:22:29
@T, that statement is not considered in this question since 'an additional price of £5 for stock purchases of 5000 or fewer shares', 5000 is included in this range.
CP
Medicmind Tutor
Fri, 07 Jan 2022 20:08:02
The answer is £107.25 when you don't round the figures throughout. slightly misleading
anon.
Medicmind Tutor
Sat, 03 Sep 2022 04:28:05
I found it challenging to give each point on the graph a specific value, similar to @CP (not rounding off the values and estimating the result). This led to a result greater than any of the options shown.
- The stock price for a listed company is given over a single day.
- The price is given in pence per share.
- To buy shares a broker will pay an ‘offer’ price of 2p more per share than the price shown, with an additional price of £5 for stock purchases of 5000 or fewer shares. Above this level, there is a charge of 0.5%.
- To sell shares a broker will be paid a ‘bid’ price 2p less than the price shown
- There is a 2.5% deduction on any profit gained by buying and selling shares.
- A company’s value is considered to be the price at which all the shares could be sold.
- There are a total 500,000 shares in the company.
- A dividend is an amount of money paid to shareholders quarterly according to how many stocks they hold.
Explanation
Answer: B
Explanation:
1. Work out the Q1 dividend for the broker:
1% of 178p = 1.78p
The broker has 105,000 shares so:
105,000 * 0.0178 = £1869
2. Find the dividend in the other quarters and the total:
Q2 is 3% higher than Q1.
Q2: £1869 x 1.03 = £1925.07
Q3 is 5% higher than Q2.
Q3: £1925.07 x 1.05 = £2021.3235
Q4 is 50% of Q1:
Q4: £1869 x 0.5 = £934.50
In total: £1869 + £1925.07 + £2021.3235 + £934.50 = £6749.80.. = £6750 to the nearest pound.
Top tip: Sometimes estimates will not be able to find the answer. Here, the £6749 and £6750 are so close together so any estimate would not get near enough to the answer.
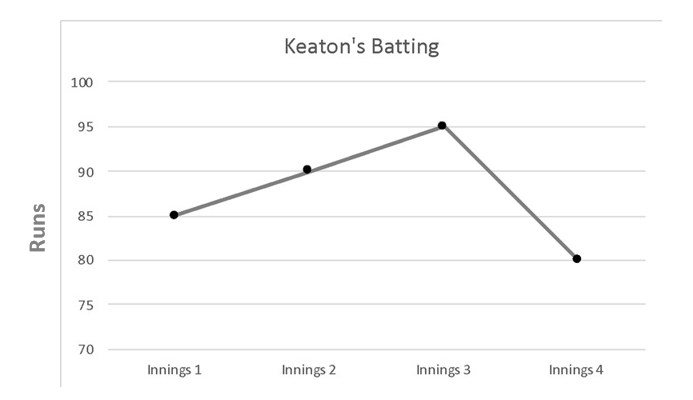
- In the first four innings of the season, Keaton has scored the above number of runs for his school cricket team.
- His school measures success by the average number of runs scored per innings.
- His bowling is above average for his age group with 15 wickets in the first four games of the season at an average of 12.5 and an economy rate of 4.
Explanation
Answer: D
Explanation:
1. Find the average after four innings:
85 + 90 + 95 + 80 = 350
350 / 4 = 87.5
2. Find the average after five innings and thus the difference:
350 + 10 = 360
360/5 = 72
Find the difference:
87.5 – 72 = 15.5 runs
Timing tip: Try to do as many of the calculations in your head or on your whiteboard as you can. This will often be quicker than using the UCAT calculator.
Graph Review Screen
Instructions
Below is a summary of your answers. You can review your questions in three (3) different ways.
The buttons in the lower right-hand corner correspond to these choices:
1. Review all of your questions and answers.
2. Review questions that are incomplete.
3. Review questions that are flagged for review. (Click the 'flag' icon to change the flag for review status.)
You may also click on a question number to link directly to its location in the exam.
Graph Section
Final Answer Review Screen
Instructions
This review section allows you to view the answers you made and see whether they were correct or not. Each question accessed from this screen has an 'Explain Answer' button in the top left hand side. By clicking on this you will obtain an explanation as to the correct answer.
At the bottom of this screen you can choose to 'Review All' answers, 'Review Incorrect' answers or 'Review Flagged' answers. Alternatively you can go to specific questions by opening up any of the sub-tests below.
Graph Section
TI-108
Fri, 19 Mar 2021 09:22:33
Could someone explain why D is incorrect? We don't know that the sales are higher w/o the total, but we can tell that the % of sales are higher?
Mon, 12 Apr 2021 10:07:13
Answer D is incorrect because there is no information about the year. It just mentions Q4 but not the year.
Sun, 27 Jun 2021 18:06:35
The correct answer is E. A cannot be incorrect just because you don't have full information total. Therefore the best answer would be there is insufficient information to draw any of these conclusions. Which is true since Answer A cannot be determine without further information. Answer E is also correct since Option B and C cannot be answered without further information which is also true for option D which does not specify the year,
Sat, 17 Jul 2021 18:10:16
Can someone please tell me why B is not correct because i thought it is clearly stated that the sales is 250 which is the highest among all of them of item x during 2018-2019, thank you
Fri, 23 Jul 2021 20:59:16
Please could someone explain why option B and why option C are incorrect, because according to the table they appear to be correct.
Thu, 02 Sep 2021 22:34:05
Hi there, since the question is :Which of the following is incorrect, aren't we supposed to be looking for the wrong answer. Therefore if E is the correct answer, it is wrong?
Mon, 13 Dec 2021 19:07:15
Hi there! I am a bit stuck as to why answer A is correct. It states that 'Sales of Item X were higher in Shop A than Shop B in Q1 of 2017-18', but if we look at the pie charts the proportion of Q1 in shop A < than shop B. Also, if the explanation states that 'without information on the total number of the sales, we cannot compare the pie charts' therefore, wouldn't this make both options A and D incorrect?? Thank you :)
Wed, 15 Jun 2022 04:26:32
It is possible the gaps between each quarter make it visually difficult to read. Maybe this is why D is incorrect...
Mon, 25 Jul 2022 00:47:50
You cannot tell if A is true or not because you don't know the number of units sold, only the proportion. Example: If I only sold two units all year, I wouldn't be outselling either shop if I sold both of them in Q1 D isn't 'incorrect' as the statement is ambiguous; You cannot tell if the question is referring to the pie chart (2017 data) or the table (2018 data)
Thu, 04 Aug 2022 14:01:46
This is so dumb lol. It asks which statement is INCORRECT and I know that the information given is insufficient but if I was to pick E this would mean that data is sufficient as id be saying that theres enough data.
Fri, 05 Aug 2022 15:00:18
is it just me or do we not get a table for shop B 2018-19?
Tue, 09 Aug 2022 12:36:57
It is a little misleading as the question is "Which of the following statements is incorrect?" which lead me to assume they were asking if the statement "There is insufficient information to draw any of these conclusions" itself was incorrect. When in fact it was the correct answer even though it was not the answer to the question.