Your Time has Finished
Loading...
BMAT 2010-S1
Your Score: %
Average Score of All Users:
You performed better than of students
Section Breakdown
| Your Score | Average of all Users | Percentile | |
|---|---|---|---|
| BMAT 2010 S1 |
BMAT 2010 S1
Your score:
Average score:
You performed better than of students
This section is Section 1 of 3.
Speed as well as accuracy is important in this section. Work quickly, or you might not finish the paper. There are no penalties for incorrect responses, only marks for correct answers, so you should attempt all 35 questions. Each question is worth one mark.
You must complete the answers within the time limit. Calculators are NOT permitted.
Good Luck!
Note – if press “End Exam” you can access full worked solutions for all past paper questions
The height and weight of three children were measured and the table below used to determine their BMI. Unfortunately some of the data have been lost. We know that Alex is 162cm tall, Jay is 150cm tall and has a BMI of 22, and Charlie is 156cm tall and has a BMI of 24. The combined weight of the children is 172kg.

Explanation
The correct answer is A.
We have Alex’s height, and we want to work out his BMI, so we need his weight. From the table, we can see Jay’s weight is 49kg and Charlie’s weight is 58kg. The combined weight of the 3 children is 172kg, so Alex’s weight must be 172-(49+58)=172-107=65kg. Therefore with a height of 162cm and a weight of 65kg, Alex’s BMI must be 25.
Societies with a flourishing arts sector (including visual art, theatre, music and dance) tend to be more democratic, more egalitarian, economically more robust and to have more fulfilled, healthier citizens. So, if we want to live in the most democratic, egalitarian and economically robust society, we should demand that the Government subsidises the arts to a level which enables them to flourish.
Explanation
The correct answer is C.
P1: Societies with a flourishing art sector are more democratic, egalitarian and economically robust.
C1: To become democratic, egalitarian and economically robust we should ask the Government to subsidise the art sector.
The main flaw here is that the passage assumes that democracy, equality and economic robustness is a result of a flourishing art sector. A is irrelevant. B and D are not mentioned in the passage.
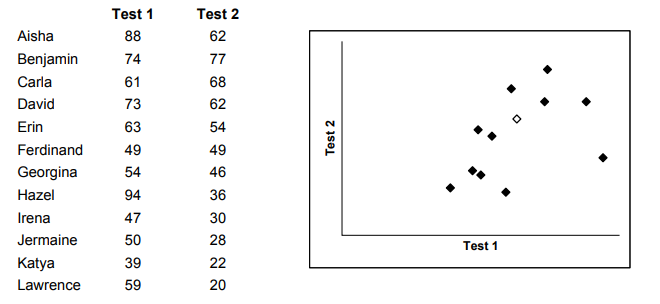
The pupils in a class took two tests. The results and the teacher’s scatter graph are shown below:
Explanation
The correct answer is C.
Hazel scored the highest on test 1. Therefore she must be represented by the rightmost diamond. We can work downwards from Hazel’s score on test 1: Aisha’s score was the next highest, so she must be represented by the second diamond from the right, followed by Benjamin and David. The next diamond from the right is the white diamond, and the next highest score on test 1 after David’s is Erin’s, so Erin must be represented by the white diamond.
62 trillion spam emails are sent every year, amounting to emissions of more than 17 million tons of carbon dioxide, one of the main contributors to global warming. More effective spam filtering could reduce the amount by 75%, which would be the equivalent of taking 2.3 million cars off the road. This would not deal with the extra energy being used to send out the messages in the first place, however. A better strategy would be to fight spam at the source. When one global web hosting firm was taken offline after it was found to have ties to spammers, global spam volume fell briefly by 70%.
Explanation
The correct answer is C.
The paragraph generally explains how reducing spam emails can help to combat global warming, as the emissions produced by spam emails were thought to be one of the main contributors to global warming (as stated by the first sentence). Therefore, tackling spam emails as one of the strategies to combat global warming, should be considered as summarised in statement C.
I need to make 72 cakes for when my guests visit tomorrow. I make the cakes in batches of 12. It takes me 40 minutes to prepare each batch and then they need to be in the oven for 25 minutes (during which time I can be working on the next batch). Once they have finished baking, I need to spend 5 minutes putting the cakes out to cool before the oven is ready for the next batch. It is now 1pm.
Explanation
The correct answer is D.
She makes 72 cakes in batches of 12, so 72/12=6 batches in total. It takes me 40 minutes to prepare each batch and then they need to be in the oven for 25 minutes. She also needs 5 minutes for putting the cakes out to cool before the oven is ready for the next batch. This would take her 6x(40+25+5)=6×70=420 minutes. But during the 25 minutes a batch is in the oven she can start working on the next batch. As there are 5 more batches to come after the first, this would take 25×5=125 minutes off the time calculated above, making the total time 420-125=295 minutes instead, which is equivalent to 4hrs and 55 minutes. 4hrs and 55 minutes after 1pm is 5:55pm.
Scientists have created a model to show how the climate would be affected if, in fifty years’ time, the world suddenly stopped the burning of fossil fuels which produces CO2 emissions. The model assumed that by then CO2 concentrations in the atmosphere would be double preindustrial levels. The scientists calculated that although levels of CO2 would fall as the oceans absorbed it, only one quarter of the CO2 in the atmosphere would have been absorbed in this way by the time the oceans had reached saturation point. The result would be a very small reduction in average global temperatures over the next 1000 years, there would be regular droughts, and sea levels would rise by up to a metre. So if the calculations as to the amount of CO2 that the oceans can absorb are correct, we cannot avoid the disastrous consequences of climate change.
1. It will be impossible suddenly to stop the burning of fossil fuels throughout the world.
2. It may be possible to reduce carbon dioxide levels significantly during the next fifty years.
3. Some predictions made in the past about climate change have not turned out to be accurate.
Explanation
The correct answer is B.
The main conclusion of the passage is that even if the world suddenly stopped burning fossil fuels, which produce carbon dioxide emission, it would not be enough to mitigate the ‘disastrous consequences of climate change’.
Statement 2 therefore weakens the argument because carbon dioxide levels could be reduced. It is correct because the model used in the passage is one that assumes that ‘carbon dioxide concentrations in the atmosphere would be double preindustrial levels.’
This would not be possible if carbon dioxide levels were to be reduced significantly.
Statement 1 is incorrect because this would act to strengthen and support the final conclusion.
Statement 3 is incorrect as there is no mention of previous predictions in the passage.
On a darts scoreboard, each number is made up by some of the lights in a 5 x 3 grid being lit. The correct appearance of each number is shown below:

Darts scores consist of three digits and the score can be anything between 002 and 501.
One night, for one player’s score, the first of the three digits was faulty and three of the lights were permanently on. All other lights were working normally. The score showed 805.
Explanation
The correct answer is B.
Only the first light was faulty, so the 05 in _05 would not change, so we only need to consider possibilities for the first digit. The possible digits must be able to make the ‘8’ shown when 3 or fewer lights are added. The first digit could be 8, 2, 5, 6, 9 or 0. But the possible range of scores is 002 to 501, so 805, 505, 605 and 905 would not have been possible. Therefore the possible first digits are 2 or 0 only.
Throughout the world, boys and girls prefer to play with different types of toys. Boys typically like to play with cars and trucks, while girls typically choose to play with dolls. Why is this? A traditional sociological explanation is that boys and girls are socialised and encouraged to play with different types of toys by their parents, peers, and “society”. Growing scientific evidence suggests, however, that boys’ and girls’ toy preferences may have a biological origin.
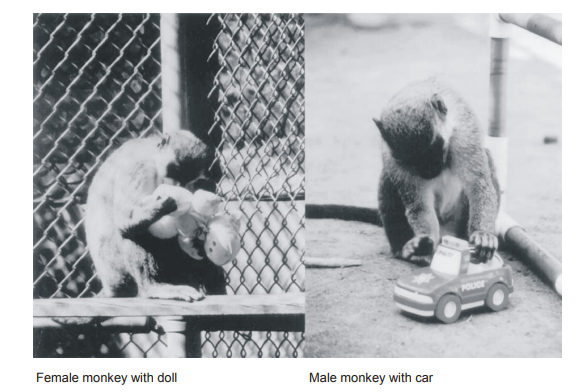
In 2002, Gerianne M. Alexander of Texas A&M University and Melissa Hines of City University in London stunned the scientific world by showing that vervet monkeys showed the same sex typical toy preferences as humans. In an incredibly ingenious study, published in Evolution and Human Behaviour, Alexander and Hines gave two stereotypically masculine toys (a ball and a police car), two stereotypically feminine toys (a soft doll and a cooking pot), and two neutral toys (a picture book and a stuffed dog) to 44 male and 44 female vervet monkeys. They then assessed the monkeys’ preference for each toy by measuring how much time they spent with each. Their data demonstrated that the male vervet monkeys showed significantly greater interest in the masculine toys, and the female vervet monkeys showed significantly greater interest in the feminine toys. The two sexes did not differ in their preference for the neutral toys.
Explanation
The correct answer is A.
The main argument made by the first paragraph is that ‘Growing scientific evidence suggests, however, that boys’ and girls’ toy preferences may have a biological origin.’. This opposes the idea that toy preference in humans is due to socialising, so A is the answer.
Throughout the world, boys and girls prefer to play with different types of toys. Boys typically like to play with cars and trucks, while girls typically choose to play with dolls. Why is this? A traditional sociological explanation is that boys and girls are socialised and encouraged to play with different types of toys by their parents, peers, and “society”. Growing scientific evidence suggests, however, that boys’ and girls’ toy preferences may have a biological origin.
In 2002, Gerianne M. Alexander of Texas A&M University and Melissa Hines of City University in London stunned the scientific world by showing that vervet monkeys showed the same sex typical toy preferences as humans. In an incredibly ingenious study, published in Evolution and Human Behaviour, Alexander and Hines gave two stereotypically masculine toys (a ball and a police car), two stereotypically feminine toys (a soft doll and a cooking pot), and two neutral toys (a picture book and a stuffed dog) to 44 male and 44 female vervet monkeys. They then assessed the monkeys’ preference for each toy by measuring how much time they spent with each. Their data demonstrated that the male vervet monkeys showed significantly greater interest in the masculine toys, and the female vervet monkeys showed significantly greater interest in the feminine toys. The two sexes did not differ in their preference for the neutral toys.

Explanation
The correct answer is A.
The answer is A because if the male monkeys were more aggressive and got hold of the ‘boyish’ toys favoured most by monkeys of both sexes, that would leave female monkeys no other option but to play with the remaining ‘girlish’ toys, despite being most attractive to the ‘boyish’ toys. This would suggest that preference does not vary according to sex.
Throughout the world, boys and girls prefer to play with different types of toys. Boys typically like to play with cars and trucks, while girls typically choose to play with dolls. Why is this? A traditional sociological explanation is that boys and girls are socialised and encouraged to play with different types of toys by their parents, peers, and “society”. Growing scientific evidence suggests, however, that boys’ and girls’ toy preferences may have a biological origin.
In 2002, Gerianne M. Alexander of Texas A&M University and Melissa Hines of City University in London stunned the scientific world by showing that vervet monkeys showed the same sex typical toy preferences as humans. In an incredibly ingenious study, published in Evolution and Human Behaviour, Alexander and Hines gave two stereotypically masculine toys (a ball and a police car), two stereotypically feminine toys (a soft doll and a cooking pot), and two neutral toys (a picture book and a stuffed dog) to 44 male and 44 female vervet monkeys. They then assessed the monkeys’ preference for each toy by measuring how much time they spent with each. Their data demonstrated that the male vervet monkeys showed significantly greater interest in the masculine toys, and the female vervet monkeys showed significantly greater interest in the feminine toys. The two sexes did not differ in their preference for the neutral toys.

Explanation
The correct answer is A.
The second paragraph comes to the conclusion that ‘ the male vervet monkeys showed significantly greater interest in the masculine toys, and the female vervet monkeys showed significantly greater interest in the feminine toys.’ based on ‘measuring how much time they spent with each’. Therefore A gives the necessary assumption.
Throughout the world, boys and girls prefer to play with different types of toys. Boys typically like to play with cars and trucks, while girls typically choose to play with dolls. Why is this? A traditional sociological explanation is that boys and girls are socialised and encouraged to play with different types of toys by their parents, peers, and “society”. Growing scientific evidence suggests, however, that boys’ and girls’ toy preferences may have a biological origin.
In 2002, Gerianne M. Alexander of Texas A&M University and Melissa Hines of City University in London stunned the scientific world by showing that vervet monkeys showed the same sex typical toy preferences as humans. In an incredibly ingenious study, published in Evolution and Human Behaviour, Alexander and Hines gave two stereotypically masculine toys (a ball and a police car), two stereotypically feminine toys (a soft doll and a cooking pot), and two neutral toys (a picture book and a stuffed dog) to 44 male and 44 female vervet monkeys. They then assessed the monkeys’ preference for each toy by measuring how much time they spent with each. Their data demonstrated that the male vervet monkeys showed significantly greater interest in the masculine toys, and the female vervet monkeys showed significantly greater interest in the feminine toys. The two sexes did not differ in their preference for the neutral toys.

1 Vervet monkeys respond to toys in the same way as humans.
2 Some monkeys show the preferences alleged by Alexander and Hines.
Explanation
The correct answer is D.
Neither 1 or 2 can be reliably concluded from the information given.
 ...
Medicmind Tutor
Sat, 25 Sep 2021 15:58:31
why
 Sarah
Medicmind Tutor
Mon, 20 Jun 2022 17:01:22
Why cannot 2 be inferred?
I am planning to tile my floor. Each tile is square and has a design which is a 3×3 grid of squares. I want to use a combination of 4 different types of tile and when I have finished I want to have used the same number of each tile. I also want the proportion of squares of each colour to be equal.
Explanation
The correct answer is C.
The combination of 4 tiles should give 12 of each colour square. Using trial by error, we can see that the combination of A, B, D and E satisfies this, so C should not be chosen.
As examination results come out again there will undoubtedly be concerns about the state ofthe education system. If the results are good then we will hear that the examinations are becoming too easy. On the other hand, if the results are poor, then we will hear about the poor state of funding for the education sector. Since there will be negative stories in the press either way, we should ignore these stories and not worry about them.
Explanation
The correct answer is E.
P1: There will be negative stories in the press either way.
C1: We should be ignore the stories.
A is not a flaw in the argument as the results can only be seen as good or bad. B is irrelevant. C is false, the passage is not making a prediction. D is irrelevant. E is therefore the flaw because it pinpoints the gap between P1 and C1.
 Helen
Medicmind Tutor
Tue, 26 Oct 2021 11:33:12
How is C incorrect when the passage states that "IF" the results are poor. Which is therefore a prediction?
These are the most common versions of the digits that appear on digital displays, and are to be assumed in this question.
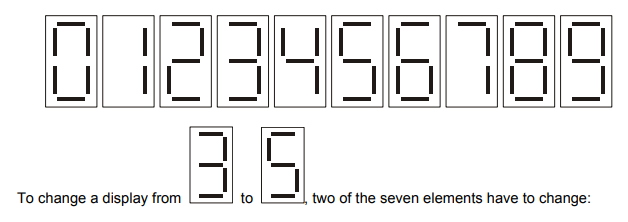
• top left changes from off to on.
• top right changes from on to off.
Explanation
The correct answer is D.
 Maria
Medicmind Tutor
Tue, 12 Apr 2022 06:08:11
Why? What is the explanation?
 Mariah
Medicmind Tutor
Thu, 28 Jul 2022 10:40:39
Changing 1 to 6 will be changing 6 elements
Although child road deaths and serious injuries have fallen by 52% in the past ten years, we should not assume that lessons in road safety are no longer vital for school pupils. A Government study reports that in 2006 almost 1,300 boy pedestrians and 700 girl pedestrians were killed or seriously injured in road traffic accidents, and that 500 child cyclists were killed or seriously injured, more than 400 of whom were male.
Explanation
The correct answer is D.
Statement D is correct because the paragraph states that ‘500 child cyclists were killed or seriously injured’ of which ‘more than 400 of whom were male.’ This means that less than 100 of these seriously injured or killed were female and thus supporting the conclusion that boys are more than twice as likely to be seriously injured or killed. Thus statement D is correct.
The image below shows a view of a conventional six sided die with opposite sides adding up to 7 (so the 1 is opposite the 6 etc).

From the position shown the die is rotated 90° in one direction and then 90° in a different direction.
Explanation
The correct answer is D.
A cannot be a possible view because in the original image the 3 dots on the 6-dot face lie parallel to the edge with the 5-dot face, whereas both lines of 3 dots on the 6-dot face lie perpendicular to the 5-dot face in A.
B would only be possible if the die was rotated 180 about the 3-dot face, but that would mean 2 90 degree rotations in the same direction, so B is also incorrect.
C is not the answer for similar reasons as A.
D, however, is a possible view after two 90 degree rotations in different directions.
When defending the British Museum’s stance on holding on to important historical artefacts that were taken from other countries, the tale of the Standard of Ur offers a huge case in support of the policy. Had Britain returned it to Iraq, it would have been lost along with so much of the country’s history when the national museum was looted. Consequently, it would have been lost to all of us. By keeping these treasures at the British Museum, their safety is ensured for the whole world.
Explanation
The correct answer is C.
The passage concludes that had Britain returned artefacts back to Iraq, they would have been lost along the a lot of the country’s history, when the natural history museum was looted. Therefore, to prevent the looting that other countries experienced, Britain should hold on to its historical artefacts for the whole world to enjoy.
The conclusion is flawed as it assumes that because other countries museums were looted, that the same would happen to Britain. Therefore, statement C is correct.
All other statements are not relevant to the main conclusion and do not directly flaw it.
The Rimmer Club is named after the character from the cult TV series “Red Dwarf” who has the letter H on his forehead.
Tonight is the Rimmer Club’s annual dinner. Rory has been given the task of making place cards. He has decided to make the cards in the form of a letter H, with dimensions as shown below:
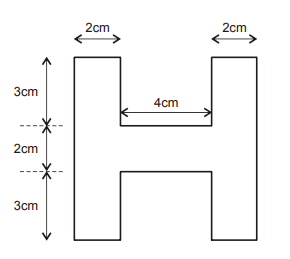
He has a number of rectangular sheets of white card, measuring 33cm by 24cm from which to make the cards.
Explanation
The correct answer is D.
 Nawaal Pasha
Medicmind Tutor
Sun, 24 Oct 2021 18:31:54
no explanation?
 Student
Medicmind Tutor
Tue, 26 Oct 2021 12:28:37
Another tip: Two ends of the H (2cm each) can fit in the centre of another H( 4cm each).
 student
Medicmind Tutor
Thu, 28 Oct 2021 10:17:54
I still don't understand how someone gets 15. I thought first to work out the area of 'H' which gives me 40 and then the area of the card which is 792 and then divide 792/40 and round down or up. How does one get 15?
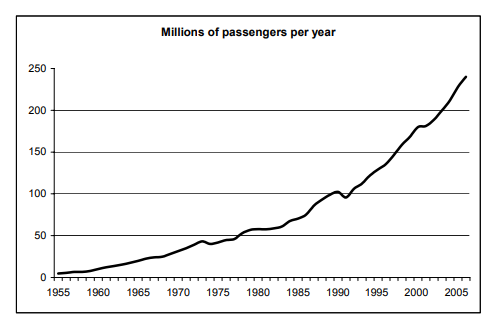
In 2005, the total number of passengers at UK airports rose to 228 million, compared to 5 million in 1955.
The numbers of passengers fell in the recession year of 1974, and in 1991, the year of the Gulf War, before continuing upward. There was also a marked flattening of the upward trend in 2001, the result of the Foot and Mouth outbreak and the September 11 attacks in New York. But these blips were temporary.
The number of passenger kilometres flown by UK airlines increased significantly over the past twenty years, from 80 billion kilometres in 1985 to 287 billion in 2005. Around 97% of the 2005 total was accounted for by international travel.
Nine in ten air passengers at UK airports in 2005 were travelling internationally. The country with which the UK exchanges the most air traffic is Spain. There were 34 million passenger movements between the two countries in 2005.
Heathrow was the busiest airport in the UK, with 68 million passengers in 2005. Gatwick was the second busiest (33 million passengers).
Demand for air travel is projected to continue growing well into the 21st century. Mid-range estimates from the Department for Transport suggest that the number of passengers at UK airports will grow to 500 million in 2030.
Notes:
Passengers on internal flights (domestic) are counted both at airport of departure and arrival.
Domestic passengers are counted both at airport of departure and airport of arrival. Suppose that domestic passengers were counted once per flight instead of both on departure and arrival, and the figures were adjusted accordingly.
Explanation
The correct answer is A (217).
Using the graph, the number of million passengers per year in 2005 is 217.

In 2005, the total number of passengers at UK airports rose to 228 million, compared to 5 million in 1955.
The numbers of passengers fell in the recession year of 1974, and in 1991, the year of the Gulf War, before continuing upward. There was also a marked flattening of the upward trend in 2001, the result of the Foot and Mouth outbreak and the September 11 attacks in New York.
But these blips were temporary.
The number of passenger kilometres flown by UK airlines increased significantly over the past twenty years, from 80 billion kilometres in 1985 to 287 billion in 2005. Around 97% of the 2005 total was accounted for by international travel.
Nine in ten air passengers at UK airports in 2005 were travelling internationally. The country with which the UK exchanges the most air traffic is Spain. There were 34 million passenger movements between the two countries in 2005.
Heathrow was the busiest airport in the UK, with 68 million passengers in 2005. Gatwick was the second busiest (33 million passengers).
Demand for air travel is projected to continue growing well into the 21st century. Mid-range estimates from the Department for Transport suggest that the number of passengers at UK airports will grow to 500 million in 2030.
Notes:
Passengers on internal flights (domestic) are counted both at airport of departure and arrival.
Explanation
The correct answer is C.
‘There were 34 million passenger movements between the two countries [spain and england] in 2005.’ This is out of 228 million in total, so in 2005 the proportion of passengers travelling to spain was 34/228. In 1980, there were approximately 60 million passengers altogether, so the number of passengers moving between england and spain can be estimated as 60×34/228=8.94=9 million.

In 2005, the total number of passengers at UK airports rose to 228 million, compared to 5 million in 1955.
The numbers of passengers fell in the recession year of 1974, and in 1991, the year of the Gulf War, before continuing upward. There was also a marked flattening of the upward trend in 2001, the result of the Foot and Mouth outbreak and the September 11 attacks in New York. But these blips were temporary.
The number of passenger kilometres flown by UK airlines increased significantly over the past twenty years, from 80 billion kilometres in 1985 to 287 billion in 2005. Around 97% of the 2005 total was accounted for by international travel.
Nine in ten air passengers at UK airports in 2005 were travelling internationally. The country with which the UK exchanges the most air traffic is Spain. There were 34 million passenger movements between the two countries in 2005.
Heathrow was the busiest airport in the UK, with 68 million passengers in 2005. Gatwick was the second busiest (33 million passengers).
Demand for air travel is projected to continue growing well into the 21st century. Mid-range estimates from the Department for Transport suggest that the number of passengers at UK airports will grow to 500 million in 2030.
Notes:
Passengers on internal flights (domestic) are counted both at airport of departure and arrival.
1 Between 1980 and 2005 the average increase per annum in the number of passengers more than trebled compared with the previous 25 years.
2 Heathrow and Gatwick between them account for more than 4 out of every 10 passengers passing through UK terminals.
3 To achieve the Department of Transport prediction for 2030, the average increase in the number of passengers going through UK terminals will have to exceed 10 million per annum.
Explanation
The correct answer is F.
Between 1980 and 2005, there was an increase of 228-60=168 million passengers per year, whereas from 1955 to 1980 the increase was 60-5=55, which is less than a third of 168, so statement 1 can be inferred.
In 2005, there were 68+33=101 million passengers in total at Heathrow and Gatwick. So out of the total number of passengers in 2005, this represents 101/228×100=44%, which is more than 4/10, so statement 2 is also correct.
‘Estimates from the Department for Transport suggest that the number of passengers at UK airports will grow to 500 million in 2030.’ The total number of passengers at UK airports was 228 million in 2005. So this would require a total increase of 500-228=272 million passengers in
2030-2005=25 years. Per annum, this equated to 272/25=10.88 million passengers. SO statement 3 can also be inferred.
Therefore, all 3 statements can be inferred from the information given.

In 2005, the total number of passengers at UK airports rose to 228 million, compared to 5 million in 1955.
The numbers of passengers fell in the recession year of 1974, and in 1991, the year of the Gulf War, before continuing upward. There was also a marked flattening of the upward trend in 2001, the result of the Foot and Mouth outbreak and the September 11 attacks in New York. But these blips were temporary.
The number of passenger kilometres flown by UK airlines increased significantly over the past twenty years, from 80 billion kilometres in 1985 to 287 billion in 2005. Around 97% of the 2005 total was accounted for by international travel.
Nine in ten air passengers at UK airports in 2005 were travelling internationally. The country with which the UK exchanges the most air traffic is Spain. There were 34 million passenger movements between the two countries in 2005.
Heathrow was the busiest airport in the UK, with 68 million passengers in 2005. Gatwick was the second busiest (33 million passengers).
Demand for air travel is projected to continue growing well into the 21st century. Mid-range estimates from the Department for Transport suggest that the number of passengers at UK airports will grow to 500 million in 2030.
Notes:
Passengers on internal flights (domestic) are counted both at airport of departure and arrival.
After the first Gulf War in the early 1990s and the flattening effects of Foot and Mouth and the September 11 attacks in 2001, passenger numbers at least recovered their previous trends. Therefore the recession of 2009, although it has brought a sharp fall in passenger numbers, will not necessarily prevent the Department of Transport’s prediction – that 500 million passengers will use UK terminals by 2030 – from being realised.
Explanation
The correct answer is D.
Examples are used to show that in the past passenger numbers had recovered despite setbacks in previous years. This suggests that the same can be done again, hence the data have been correctly interpreted and do support the conclusion.
One fund-raising activity of a particular sports club is a weekly draw. Participants choose two different numbers between 1 and 15 inclusive. When the draw is made, two numbers between 1 and 15 inclusive are selected at random. The prize money is shared by anyone who has chosen these two numbers. If there are no winners, the prize fund rolls over to the following week.
When last week’s winning numbers were announced as 3 and 10, someone pointed out that it was the fifth successive week that the two numbers consisted of a total of three digits, all different.
Explanation
The correct answer is E.
 Nawaal Pasha
Medicmind Tutor
Sun, 24 Oct 2021 18:34:41
no explanation?
 Annq
Medicmind Tutor
Wed, 10 Aug 2022 12:50:36
where
Scientists have argued over whether the extinction of the dinosaurs was caused by a space impact or by super-volcanic activity which lasted for 1.5 million years. The space impact would have caused sudden large-scale fires and earthquakes. Volcanic activity would have caused a cooling of the atmosphere and acid rain which would be seen in changes to marine and land ecosystems over the 500,000 years before the extinction. As no such changes were identified during this period, the space impact is the only plausible explanation.
Explanation
The correct answer is C.
The conclusion is that the space impact is the only plausible explanation as the changes listed in the paragraph weren’t identified.
However it is assuming that those are the only plausible explanations for the extinction of dinosaurs. This assumption is needed for the argument to exist
I am playing a card game with three friends. Each of us has two cards which are placed face up on the table. The score for a hand is calculated by adding up the value of the two cards and then doubling the total if the cards are the same suit (denoted by the symbols ♥, ♦, ♣ or ♠).
The highest score wins. My two cards are the 2♠ and 7♥. The other hands are:
• 4♦ and 7♦
• 5♣ and 8♠
• 2♥ and 9♣
I am the last person to play. I can exchange one of my cards with a card from another hand and I want to finish in the highest position possible.
Explanation
The correct answer is A.
To get the highest possible score, there 2 of spades could be exchanged for the 3 of hearts, so that both the player’s cards are hearts, so his score of 2+7=9 would be doubled to 18. However, the player wants to finish in the highest position possible out of the 4 players, which does not necessarily means he wants the highest score. If he did swap his 2 of spades for a 2 of hearts, the other hand of 4 of diamonds and 7 of diamonds would beat his, as the total score of 4+7=11 would be doubled to give 22, which is greater than 18. So instead, in order to finish in first position, the player could swap his 2 of spades for the 7 of diamonds in the other hand. This would give them scores of 7+7=14 and 4+2=6 respectively.
The behaviour of the general public has contributed to the reluctance of doctors to do out-ofhours work. When doctors only ever had to deal with genuine medical emergencies out-ofhours then the workload was manageable. Unfortunately, the Government has helped stoke public expectations so that now people think they should be entitled to full medical care 24 hours a day, no matter how trivial the problem is. However, minor problems should be dealt with at day surgeries.
Explanation
The correct answer is A.
Statement A is paraphrased in the first sentence whereby doctors are reluctant to work any additional hours outside of their normal working hours due to the general public’s behaviour.
Statement B is incorrect because there is no mention how the Government has encouraged doctors to offer more out-of-hour work for urgent/non-urgent services.
Statement C is also incorrect as there is no distinction drawn about how the public differentiates between urgent and non-urgent services.
Statement D is incorrect because although doctors may see a greater number of patients who are non-urgent during out-of-hour times, it is not the main conclusion.
Statement E is incorrect because there is no mention that despite the increased workload of doctors during out of hours time, that they should therefore turn away patients to manage the workload.
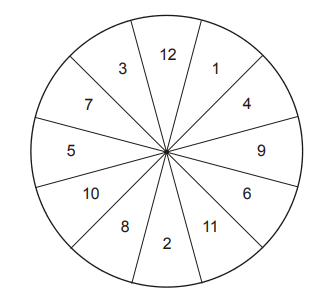
A target at a fair has twelve sections, marked as shown above. Participants throw four darts at the target. They win a prize if all four darts land in different sections of the target and the total score is at least 30.
Phil has thrown two of his four darts, scoring 12 and 8. He is confident that whenever he throws he will hit the target and, whatever section he aims at, the dart will never land further away than one of the two neighbouring sections. With this in mind, he realises that if he aims his third dart at 5 or 6 he can be confident of winning a prize.
Explanation
The correct answer is C.
Phil’s score so far is 12+8=20. So his next 2 scores must have a total of at least 10. So eliminate A, because if he hit two 4s his total would be less than 10. Eliminate B and E because 3 and 2 respectively are in neighbouring segments and are both less than 5. Eliminate D because a neighbouring segment is 8 and he has already scored an 8.
C is the answer.
During the trial of a 10 year old accused of frequent violent crimes, privacy laws meant that he could only be referred to in the media as ‘Child B’. One newspaper, however, continually referred to the boy as the ‘Devil Child’. Despite many media sources reporting the difficult and violent upbringing the boy himself had had, calling for understanding and leniency, many letters sent to newspapers and comments posted on internet forums showed strong public anger and calls for the harshest possible sentence. Almost all of those calling for tough measures used the term ‘Devil Child’. This shows that the name alone had influenced public opinion and prevented members of the public having sympathy for the child.
1. The newspaper that used the term ‘Devil Child’ reported the case and the child’s upbringing accurately.
2. The editors of the newspaper that used the term ‘Devil Child’ also called for the harshest possible punishment.
3. The newspaper that used the term ‘Devil Child’ had also continually referred to his victims as ‘innocent’ and ‘defenceless’.
Explanation
The correct answer is A.
The passage concludes that those people calling for tough measures used the term ‘Devil Child.’ The name alone was responsible for forming public opinion and ‘prevented members of the public having sympathy for the child.’
This is strengthened by statement 1 because if newspapers were accurate in the child’s upbringing and case, then it could be assumed that the newspapers information did not contribute to the bias, but rather the name ‘Devil Child’ could have been the deciding factor to the public having a biased view.
Statements 2 and 3 are incorrect because the wording in the newspapers would have been a factor that could have swayed the public’s opinion. Thus it does not support the argument that the use of the phrase ‘Devil’s Child’ was the sole factor that influenced the public’s opinion.
Paul, who works in the fruit and vegetable section of a supermarket was given the job of making up packs of three apples from the contents of a large box of loose apples. Each pack had to weigh 600g, with an allowance of no more than 3g heavier or lighter.
When there were just seven apples left in the box he feared that he might not be able to make up any more packs, but after weighing them he found that he was able to make up two more.
The seven apples weighed 173g, 182g, 188g, 197g, 207g, 219g and 224g
Explanation
The correct answer is C.
One of the packs contains apples weighing 173, 207 and 219 grams. The other pack 182, 197 and 224 grams. This leaves the apple weighing 188g.
Reducing class sizes in UK primary schools to 20 pupils would be very expensive and would produce little improvement in children’s education. This is confirmed by evidence from the USA. In the 1990s class sizes were reduced in California because the state had been ranked 49th out of 50 states in the reading ability of 9 to 10 year olds. Ten years and $50 billion later, California had risen only to 48th out of 50. If class sizes are reduced, more teachers are needed. Thus, in the UK, candidates with lower qualifications would have to be recruited, since there are already only 1.2 applicants for each teaching post. What is important is not whether there are 20 or 30 children in a classroom, but whether there is one good teacher. Countries whose children do well at school are those that recruit their teachers from the brightest graduates.
Explanation
The correct answer is B.
Statement A is an assumption in the area highlighted in red.
Statement C is an assumption in the area highlighted in purple.
Statement D is an assumption in the area highlighted in yellow.
Statement B is not an assumption as the argument explains the idea of reducing class sizes is not justified for other reasons – the fact that it is expensive is an external reason but is not needed for the argument to hold.
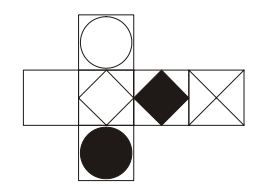
The net shown can be folded up to make a cube.
Explanation
The correct answer is D.
A is not identical because the position of the black and white circles have been swapped. B is not correct because the plain white face would be opposite to the face with the white square, when it should be adjacent to it. C is incorrect because the position of the black square and black circle have been swapped. E is wrong because the circles are adjacent to each other when they should be facing opposite each other when the net is folded. Hence, D is the answer.
Vitelo Pareto observed that in Italy in 1906 that 80% of the wealth was owned by 20% of the people. The ‘Pareto Principle’ has since been applied to a wide range of other areas. For example in the USA it has been found that 20% of the population use 80% of the health care resources. Although most developed countries have a somewhat more even distribution of wealth in modern times, on a global scale it has been estimated that currently 20% of the world’s population have 82.7% of the world’s income.
Various parameters are used to give a measure of inequality of income within a society. One of the simplest of these is the ratio of the average income of the best paid 20% of the population to that of the lowest paid 20%. Among countries this ratio varies from 4.5 for Japan to 168 for Bolivia. It is clearly very high for some developing countries because a significant part of the population has no measurable income at all.
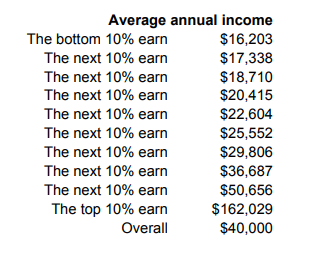
In the fictional country of Capitalia, the income distribution is as follows:
Explanation
The correct answer is C.
For the bottom 20%: 16000+17000=33000. For the top 20%: 51000+162000=213000. We do not need to divide either figure by 2 because this will not affect the ratio. The ratio would be approximately 213000:33000~210:30=7:1. The closest to this out of the options given is 6:1.
Vitelo Pareto observed that in Italy in 1906 that 80% of the wealth was owned by 20% of the people. The ‘Pareto Principle’ has since been applied to a wide range of other areas. For example in the USA it has been found that 20% of the population use 80% of the health care resources. Although most developed countries have a somewhat more even distribution of wealth in modern times, on a global scale it has been estimated that currently 20% of the world’s population have 82.7% of the world’s income.
Various parameters are used to give a measure of inequality of income within a society. One of the simplest of these is the ratio of the average income of the best paid 20% of the population to that of the lowest paid 20%. Among countries this ratio varies from 4.5 for Japan to 168 for Bolivia. It is clearly very high for some developing countries because a significant part of the population has no measurable income at all.
In the fictional country of Capitalia, the income distribution is as follows:

Explanation
The correct answer is C.
162029/(40000×10)x100. As this a percentage, we can simplify the calculation: 162/(40×10)x100=162/400×100=40.5%.
Vitelo Pareto observed that in Italy in 1906 that 80% of the wealth was owned by 20% of the people. The ‘Pareto Principle’ has since been applied to a wide range of other areas. For example in the USA it has been found that 20% of the population use 80% of the health care resources. Although most developed countries have a somewhat more even distribution of wealth in modern times, on a global scale it has been estimated that currently 20% of the world’s population have 82.7% of the world’s income.
Various parameters are used to give a measure of inequality of income within a society. One of the simplest of these is the ratio of the average income of the best paid 20% of the population to that of the lowest paid 20%. Among countries this ratio varies from 4.5 for Japan to 168 for Bolivia. It is clearly very high for some developing countries because a significant part of the population has no measurable income at all.
In the fictional country of Capitalia, the income distribution is as follows:

Explanation
The correct answer is C.
Add together the 2 top 10% incomes: 51000+162000=213000
Find 20% of this: 213000×0.20=42600
Divide this among each 10% of the remaining 80%: 42600/8=5325
Add this to the earnings of the bottom 10%: 5300+16200=21500.
Vitelo Pareto observed that in Italy in 1906 that 80% of the wealth was owned by 20% of the people. The ‘Pareto Principle’ has since been applied to a wide range of other areas. For example in the USA it has been found that 20% of the population use 80% of the health care resources. Although most developed countries have a somewhat more even distribution of wealth in modern times, on a global scale it has been estimated that currently 20% of the world’s population have 82.7% of the world’s income.
Various parameters are used to give a measure of inequality of income within a society. One of the simplest of these is the ratio of the average income of the best paid 20% of the population to that of the lowest paid 20%. Among countries this ratio varies from 4.5 for Japan to 168 for Bolivia. It is clearly very high for some developing countries because a significant part of the population has no measurable income at all.
In the fictional country of Capitalia, the income distribution is as follows:

The graphs below show an index of health as a function of both inequality and wealth for a range of countries (the same group of developed countries is shown in both graphs).
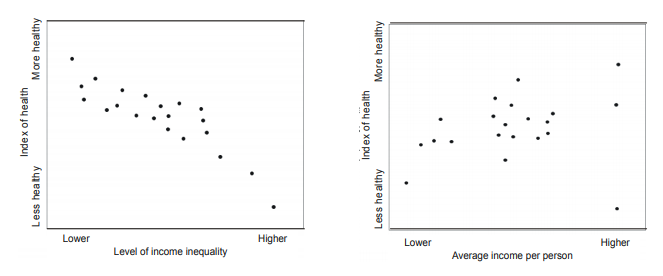
1 Within any given country, the richer people are no healthier than the poor.
2 Countries with less variability of income generally have healthier people.
Explanation
The correct answer is B.
Statement 1 is very extreme, and regardless of what the graph suggests, it would be impossible to conclude that ‘Within any given country, the richer people are no healthier than the poor.’ in all cases.
Statement 2, however, acknowledges a general trend shown by the first graph: the lower the level of income inequality, generally the greater the index of health. Therefore only statement 2 can be concluded from the information given.
BMAT 2010 S1 Review Screen
Instructions
Below is a summary of your answers. You can review your questions in three (3) different ways.
The buttons in the lower right-hand corner correspond to these choices:
1. Review all of your questions and answers.
2. Review questions that are incomplete.
3. Review questions that are flagged for review. (Click the 'flag' icon to change the flag for review status.)
You may also click on a question number to link directly to its location in the exam.
BMAT 2010 S1 Section
Final Answer Review Screen
Instructions
This review section allows you to view the answers you made and see whether they were correct or not. Each question accessed from this screen has an 'Explain Answer' button in the top left hand side. By clicking on this you will obtain an explanation as to the correct answer.
At the bottom of this screen you can choose to 'Review All' answers, 'Review Incorrect' answers or 'Review Flagged' answers. Alternatively you can go to specific questions by opening up any of the sub-tests below.
BMAT 2010 S1 Section
TI-108
Let's get acquainted ?
What is your name?
Nice to meet you, {{name}}!
What is your preferred e-mail address?
Nice to meet you, {{name}}!
What is your preferred phone number?
What is your preferred phone number?
Just to check, what are you interested in?
When should we call you?
What time works best for you? (UK Time)
How many hours of 1-1 tutoring are you looking for?
My WhatsApp number is...
For our safeguarding policy, please confirm...
For our safeguarding policy, please confirm...
Which online course are you interested in?
What is your query?
SubmitYou can apply for a bursary by clicking this link
https://www.medicmind.co.uk/medic-mind-foundation/Sure, what is your query?
SubmitLoading...
Thank you for your response.
We will aim to get back to you within 12-24 hours.
Lock in a 2 Hour 1-1 Tutoring Lesson Now
If you're ready and keen to get started click the button below to book your first 2 hour 1-1 tutoring lesson with us. Connect with a tutor from a university of your choice in minutes. (Use FAST5 to get 5% Off!)
Buy Now for £70